Fed and tech earnings take center stage
Key Takeaways:
- The Fed held the fed funds target range unchanged at 3.5%-3.75%, as expected, although three policymakers dissented in favor of a quarter-point hike.
- Treasury yields rose following the meeting, with the largest moves in long-term bonds, steepening the yield curve.
- Earnings from four Magnificent 7 companies led to mixed market reactions, suggesting that investors increasingly want evidence that heavy AI spending is translating into durable revenue and earnings growth.
- Interest rates may remain higher for longer, but resilient economic growth, strong corporate earnings, and broader participation across sectors can continue to help support equities.
Fed holds rates steady, as expected
The Federal Open Market Committee's (FOMC) July meeting was a key focus for markets this week. Because the decision to hold rates steady for a fifth consecutive meeting was widely expected, markets focused more closely on the policy statement and Chair Kevin Warsh's tone during the press conference.
The committee voted 9-3 to maintain the fed funds target range at 3.5%-3.75%. The dissenting votes came from regional Fed presidents who favored a quarter-point increase and have expressed concerns about slow progress in returning inflation toward the 2% target. The split confirmed that a hawkish and increasingly vocal contingent has emerged within the committee, though the majority of policymakers are not yet prepared to tighten policy.
Warsh reiterated in the press conference the Fed's commitment to restoring price stability and said policymakers are prepared to act if necessary. He also acknowledged that bond yields had risen materially, suggesting that bond markets may be doing some of the Fed's work, potentially reducing the need for an immediate policy response. Markets appeared to interpret the overall message as firm on inflation but less clear about the timing of the Fed’s next move. Treasury yields rose following the meeting, particularly at the long end of the curve, with the 30-year yield reaching its highest mark since 2007.
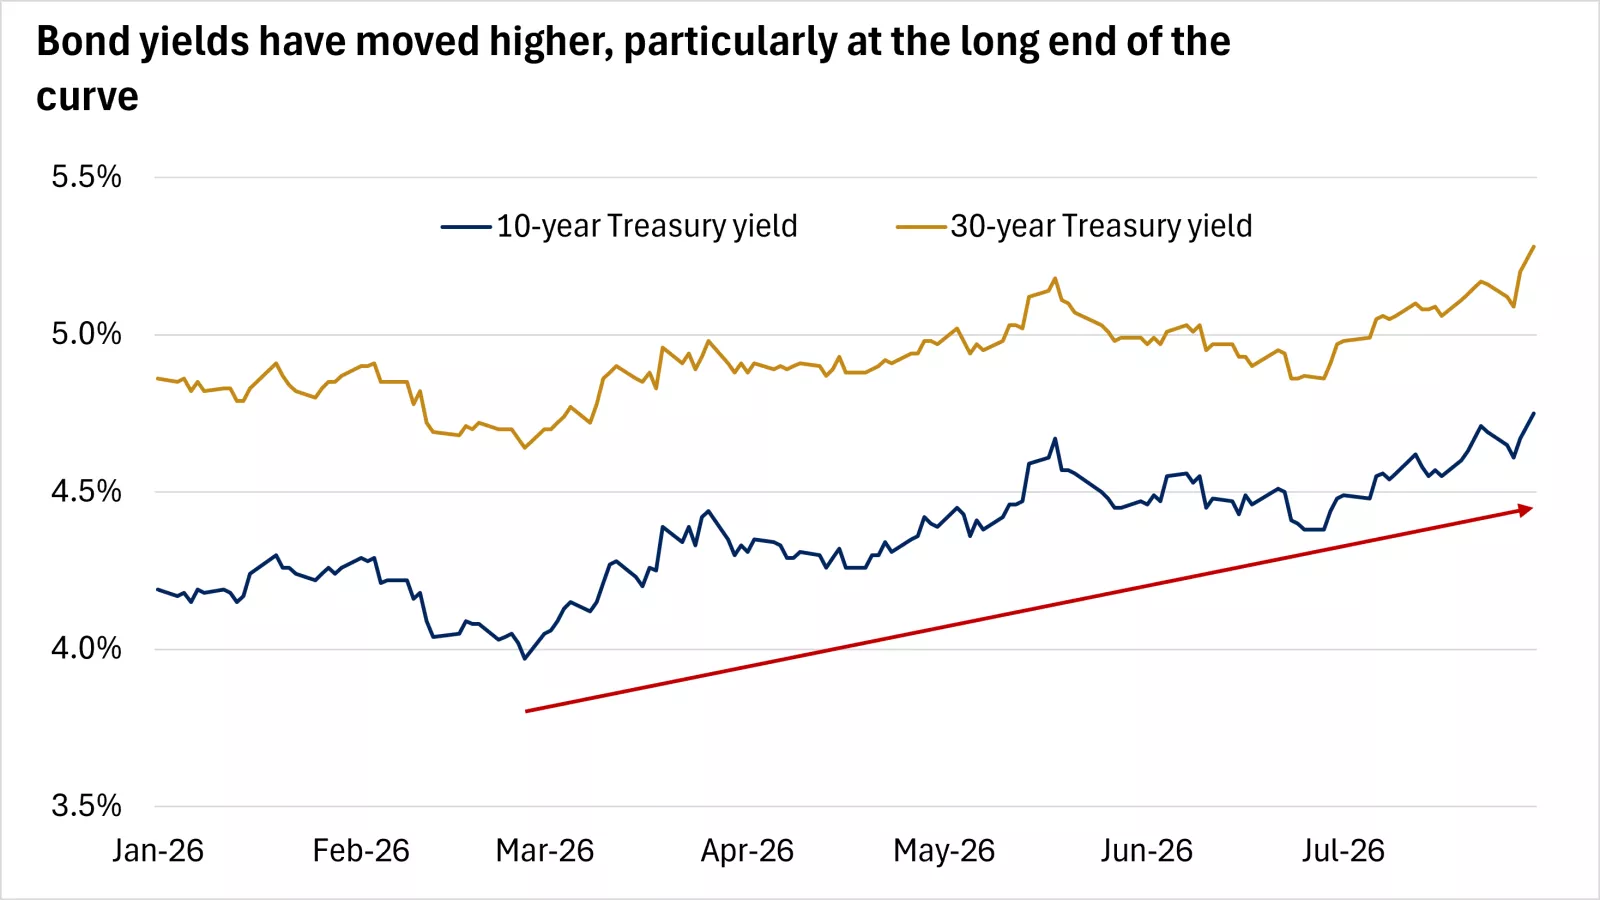
The chart shows that Treasury bond yields have moved higher, particularly at the long end of the curve. Past performance does not guarantee future results.
The chart shows that Treasury bond yields have moved higher, particularly at the long end of the curve. Past performance does not guarantee future results.
Importantly, inflation expectations priced into bond markets remained contained, as reflected by breakeven inflation rates in Treasury Inflation-Protected Securities TIPS markets in the 2.2%-2.3% range. TIPS principal balances adjust based on the consumer price index (CPI), which historically has tended to run somewhat higher than the Fed's preferred personal consumption expenditures (PCE) price index, which means breakevens appear broadly consistent with inflation moving closer to the Fed's target over time, in our view. As a result, we believe the recent rise in interest rates has been driven mostly by real yields and yield-curve steepening, though some market participants also appear to be starting to question the Fed's inflation-fighting credibility. For bond investors, higher real yields can enhance inflation-adjusted income.
Sticky inflation could force the Fed's hand
Headline PCE inflation eased to 3.7% in June, as expected, down from 4.1% in May. The decline partly reflected lower oil prices following a temporary U.S.-Iran ceasefire. Core PCE inflation, which excludes the more volatile food and energy categories, edged down to 3.3%. However, both measures remain well above the 2% target, shown below.
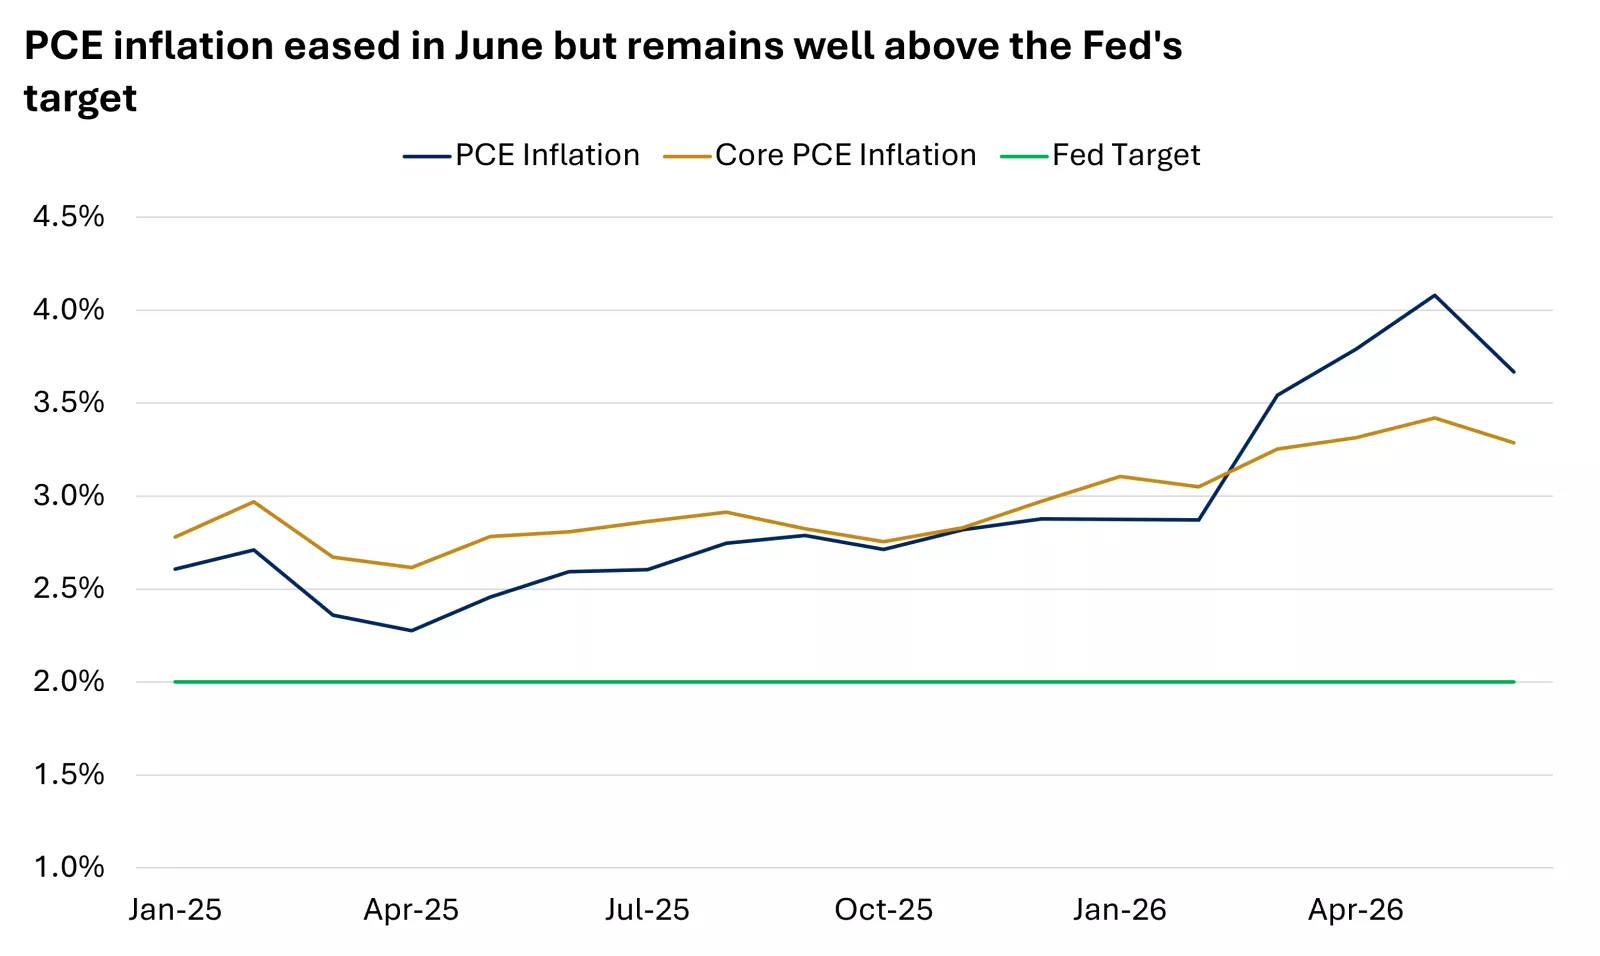
The chart shows that PCE inflation moderated in June but remained above the Fed's target.
The chart shows that PCE inflation moderated in June but remained above the Fed's target.
Lower energy prices can reduce headline inflation relatively quickly, but sustained improvement in the Fed's preferred core measure will likely require continued moderation in services price pressures, in our view.
The labor market also helps give policymakers room to prioritize inflation risks. The unemployment rate remains contained at 4.2%, in line with the Fed's long-run projection, which is widely viewed as its estimate of full employment. Average wage gains increased 3.5% in June from a year earlier, indicating that compensation growth remains manageable.
Overall, labor-market conditions appear to be broadly balanced. This should help reduce the risk of a wage-price cycle adding to price pressures. With the employment side of the Fed's dual mandate broadly being met, we think policymakers should be able to maintain greater focus on restoring price stability.
In our view, the likelihood of a rate hike is rising, particularly if geopolitical tensions persist and oil prices rebound or inflation becomes more broad-based. Tighter monetary policy cannot directly resolve a supply shock, but it can help prevent higher energy prices from becoming embedded in inflation expectations.
With economic growth supported by resilient consumer spending and continued AI-related investment, we think the Fed will likely focus on whether inflation pressures are temporary or are becoming more persistent in the months ahead. September could therefore be a live meeting, with the probability of a rate hike rising if oil prices climb or if price pressures broaden. July and August inflation readings and developments in energy markets will be important in determining the Fed’s next move, in our view.
Mega-cap technology companies contribute to a strong earnings season
Four of the Magnificent 7 companies (Magnificent 7 represented by Apple, Alphabet, Amazon, Meta, Microsoft, NVIDIA and Tesla) reported earnings this week, with mixed market reactions. Microsoft and Amazon shares rallied following stronger cloud-computing revenue, while Meta's stock price moved lower as markets focused on an earnings miss and softer guidance amid elevated capital spending. Apple shares also declined as cost concerns and the company's cautious outlook appeared to disappoint investors.
The broader takeaways were that AI investment remains a durable theme, as several companies raised their capital-expenditure outlook, although share-price performance is beginning to diverge more meaningfully, in our view. We believe this represents an important shift in the AI investment cycle. The market appears to be moving from rewarding companies for AI spending to assessing the revenue and earnings that these investments can generate. This shift could raise the bar for companies with aggressive investment plans. Large technology companies may have the balance sheets, cash flows and access to capital to sustain elevated spending, but investors appear more likely to scrutinize the timing of returns more closely.
More broadly, second-quarter results have been strong. More than halfway through earnings season, 86% of the S&P 500 companies that have reported have beaten analyst estimates, with an average upside surprise of 31%. As a result, forecasts for second-quarter earnings growth have been revised sharply higher to 37%, up from 22% at the end of the quarter. Energy companies have posted the strongest growth — supported by higher oil prices during the quarter — followed by the communications and consumer discretionary sectors. Earnings gains have also been broad-based, with 10 of the 11 sectors reporting year-over-year increases.
We believe wider participation in earnings growth could help make the market's advance more durable by reducing its reliance on a small group of mega-cap companies. It could also help create a more favorable backdrop for diversified portfolios. Earnings growth is expected to remain strong, supported by a steady labor market, resilient economic growth, and health consumer spending, shown in the chart below:
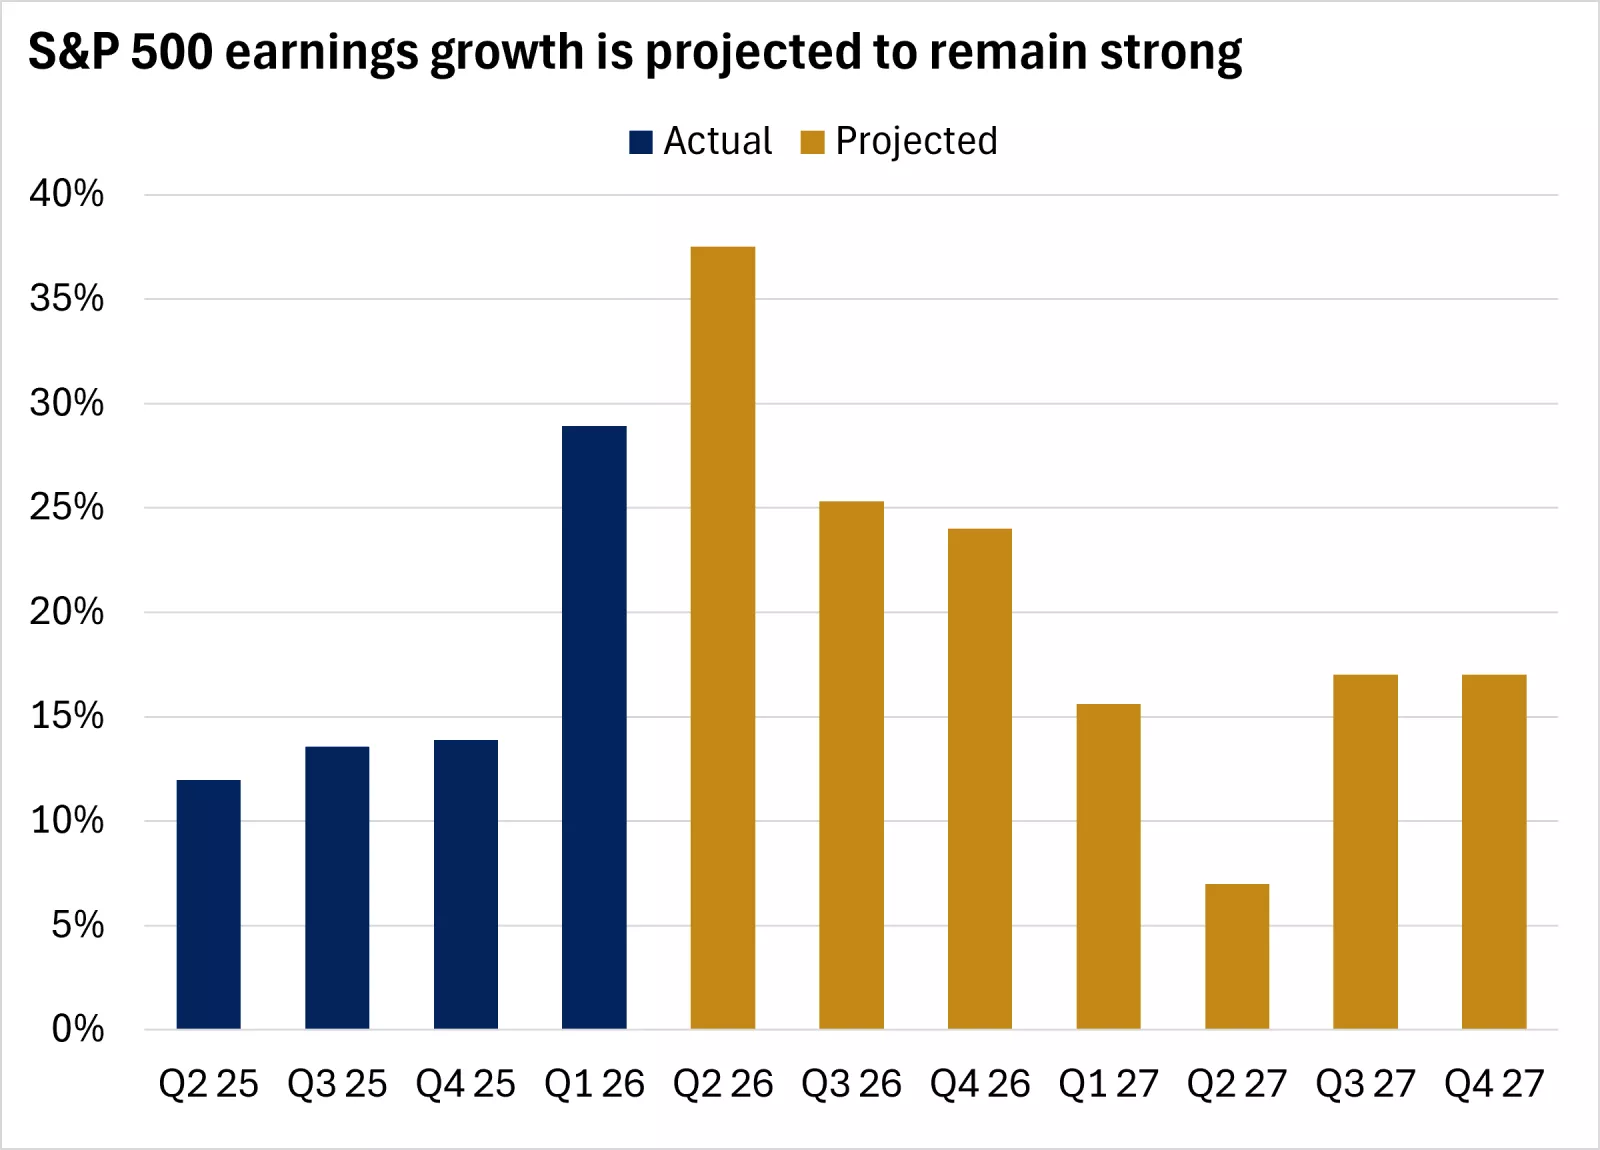
The chart shows that S&P 500 earnings growth is projected to remain strong. Past performance does not guarantee future results. An index is unmanaged, cannot be invested into directly and is not meant to depict an actual investment.
The chart shows that S&P 500 earnings growth is projected to remain strong. Past performance does not guarantee future results. An index is unmanaged, cannot be invested into directly and is not meant to depict an actual investment.
What this means for investors
Interest rates likely to remain higher for longer
Sticky inflation, a steady labor market, and resilient economic growth suggest that policy rates could remain elevated for an extended period. The Fed may be inclined to hike over the coming months, depending on incoming data. At the same time, higher real yields can help improve the inflation-adjusted income available from fixed-income investments. We recommend neutral allocations to U.S. high-yield bonds and emerging-market debt to enhance income potential, given the supportive backdrop. Underweight positions in U.S. investment-grade and international bonds can help offset overweight positions in equities.
Continued earnings strength can help support equity markets
Higher-for-longer rates could remain a potential headwind for equities, but resilient consumer spending and strong earnings can help offset higher discount rates. Valuations have pulled back recently, but earnings growth has offset much of the impact and helped support performance.
S&P 500 earnings are on pace to grow by more than 27% this year, while economic activity remains healthy, supported by stable labor-market conditions, steady consumer spending, and improving manufacturing activity. Against this backdrop, we believe equity markets can continue to perform well in the months ahead.
We see opportunities in U.S. large- and mid-cap stocks and emerging-market equities, which we think stand to benefit from their exposure to tech innovation and related infrastructure buildout. We expect U.S. stocks to benefit from the relative strength of the U.S. economy, supported by a steady labor market and consumer spending.
The AI investment cycle is evolving
AI-related capital spending remains a powerful driver for technology investment, data-center construction, semiconductor demand, and related infrastructure. However, the next phase of the cycle is likely to be more selective, in our view. Investors appear to be increasingly distinguishing between companies that are spending on AI and those that can monetize those investments.
Overall, we recommend staying invested while recognizing that geopolitical developments and monetary-policy uncertainty may remain sources of volatility. Your financial advisor can help ensure that your investments are adequately diversified, in line with your risk tolerance, and on track to achieve your long-term financial goals.
Brian Therien, CFA
Investment Strategy
Source for all data in commentary: FactSet
Brian Therien
Brian Therien is a Senior Fixed Income Analyst on the Investment Strategy team. He analyzes fixed-income markets and products, and develops advice and guidance to help clients achieve their long-term financial goals.
Brian earned a bachelor’s degree in finance from the University of Illinois at Urbana–Champaign, graduating with honors. He received his MBA from the University of Chicago Booth School of Business.
Important Information:
The Weekly Market Update is published every Friday, after market close.
This is for informational purposes only and should not be interpreted as specific investment advice. Investors should make investment decisions based on their unique investment objectives and financial situation. While the information is believed to be accurate, it is not guaranteed and is subject to change without notice.
Investors should understand the risks involved in owning investments, including interest rate risk, credit risk and market risk. The value of investments fluctuates and investors can lose some or all of their principal.
Past performance does not guarantee future results.
Market indexes are unmanaged and cannot be invested into directly and are not meant to depict an actual investment.
Diversification does not guarantee a profit or protect against loss in declining markets.
Systematic investing does not guarantee a profit or protect against loss. Investors should consider their willingness to keep investing when share prices are declining.
Dividends may be increased, decreased or eliminated at any time without notice.
Special risks are inherent in international investing, including those related to currency fluctuations and foreign political and economic events.
Before investing in bonds, you should understand the risks involved, including credit risk and market risk. Bond investments are also subject to interest rate risk such that when interest rates rise, the prices of bonds can decrease, and the investor can lose principal value if the investment is sold prior to maturity.