Our 2026 outlook is live and we have six Edward Jones investment strategists here to share the highlights. Now, overall, we think 2026 can be a year of positive returns driven by steady economic growth and rising corporate profits. However, we are in year four of this bull market and we're mindful of potential risks, including AI uncertainty and lingering inflation. So let's dive in. After a bumpy 2025, we expect growth to stabilize around 2% in 2026, helped by tax cuts, lower interest rates, looser regulation and AI investment. We expect inflation to remain uncomfortably high around 3%, squeezing households and limiting the Fed's ability to cut interest rates. After three years of strong gains and rising valuations, we expect corporate profits to do the heavy lifting in 2026. The good news is that earnings growth looks ready to broaden, narrowing the gap between tech and other sectors. AI will likely remain a powerful driver, but leadership may rotate. This is why maintaining exposure to innovation while avoiding overconcentration will be critical in 2026. We expect another favorable year for international markets in 2026, supported by improving economic activity in Europe and enthusiasm around emerging market technology companies. With the US yield advantage narrowing relative to other developed markets, we also see scope for a flat to weaker dollar in 2026, perhaps providing support to international return for U.S. investors. Given the S&P 500’s heavy concentration in the ten largest companies incorporating allocations to international stocks can help broaden investor opportunity sets and manage risk, reinforcing the case for international diversification. In 2026, we expect the fed funds rate to settle in the 3 to 3.5% range, with ten year Treasury yields holding near 4 to 4.5%, with cash yields likely to fall further toward 3% as rate cuts progress, consider reinvesting excess cash. The yield advantage of bonds over cash could widen as well. Setting the stage for fixed income to outperform cash again next year. We believe one of the most compelling actions investors can take in their portfolio is doubling down on diversification. We're seeing opportunities across sectors and market caps, including us large and mid-cap stocks and in global markets, which can help you stay ahead of inflation and avoid overconcentration. Now is also a great time to review your financial strategy and make sure you're on track toward your goals.
Edward Jones investment strategists take you through the highlights of our 2026 Outlook and share planning strategies to help diversify and position your portfolio in 2026.
As we look back on 2025, it is remarkable to think about the highs and lows we experienced, particularly as investors and observers of financial markets. The year began with optimism around the possibilities for the Fed and a new administration — but quickly turned to upheaval around global trade and new tariff policy uncertainty. Nonetheless, as we moved past April, markets seemed almost lulled into complacency, soothed by quarter after quarter of stellar earnings, especially in the AI and mega-cap technology sector.
Now, as we enter 2026 and the bull market begins its fourth year, the question for investors is whether the gains can continue. We think this can be a year of positive returns, but earnings growth in tech and non-tech parts of the market will do most of the heavy lifting, with limited scope for valuation expansion. Our base case calls for steady economic growth, a Fed that continues to cut interest rates, and double-digit corporate earnings growth across many sectors. However, there are tail risks to the story, including potential AI disappointment and stubborn inflation trends.
In our view, the most compelling action investors can take this year is to double down on diversification. We see opportunities across market caps, sectors and geographies — which can provide investors the potential to not only outperform but also avoid overconcentration and outpace inflation rates. We also see planning opportunities in the year ahead, whether responding to regulatory changes or simply checking in on your progress toward your financial goals. Read more in our 2026 outlook: innovation and AI matter, so does diversification.
Sincerely,
The Edward Jones Wealth Management Team
Here are our 10 key views for 2026
The U.S. economy had lots to contend with in 2025: upheavals in trade policy, a slowing labor market and a record-breaking government shutdown. Despite these disruptions, growth looks set to come in around 2%, representing healthy activity rates. We expect this solid, Goldilocks-esque GDP growth to continue through 2026 in what should hopefully be a smoother ride.
There are a few reasons for this optimism.
First, we should see the benefits of tax cuts passed earlier this year show up in larger refunds next spring, modestly boosting household spending power. Businesses will also benefit from this legislation, with a more favorable tax treatment of investment likely to encourage capex and R&D.
Second, the Fed is expected to continue to take its foot off the policy brakes, lowering interest rates from levels that present a drag on the economy toward more neutral settings. We expect this easing will lessen the burden of existing debt and encourage new investment and spending in the economy.
Third, regulatory policy changes are likely to gain traction next year. Leadership changes across a range of government agencies are expected to deliver looser guidelines around energy, banking and competition policy, potentially reviving animal spirits.
Fourth, the AI investment boom looks set to continue, helping to lift spending across a range of digital technologies, data centers and power infrastructure as the rapid adoption of this burgeoning technology increases electricity demand.
Finally, the noise around trade policy should quiet in 2026. Certainly, the uncertainty this year has weighed on business sentiment, and seemingly hiring too. More stability around tariffs and trade relationships should lessen this apprehension.
Tempering our optimism is the ongoing slowdown in U.S. labor force growth, which creates something of a speed limit on the economy. An aging population, low rates of immigration and higher deportations could all weigh on growth, particularly in sectors sensitive to labor shortages.
Still, another year of 2% GDP growth would present a solid backdrop for markets, especially if it comes absent the big swings in sentiment seen this year.

This chart shows the impact of this year's GOP reconciliation bill on after tax and transfer incomes across the household income distribution.
This chart shows the impact of this year's GOP reconciliation bill on after tax and transfer incomes across the household income distribution.
Two forces have shaped the labor market in 2025 and we believe will continue to do so through 2026.
The first is a precipitous slowdown in labor force growth due to an aging population, a sharp decline in net immigration and more Americans choosing not to work. Dallas Fed research finds that the number of newcomers into the labor market each month has plummeted from 200,000 – 250,000 in 2023 to 30,000 this year.
Second, firms are reluctant to hire. New job openings have fallen, business survey data indicates subdued hiring intentions and consumer surveys corroborate this caution, with more households reporting it is harder to find work right now.
A reluctance to hire new staff likely reflects some of the uncertainty faced by businesses this year, although there is some evidence that AI is also starting to impact these trends too. Analysis of 2025 labor data points to around 1 in every 20 layoffs being attributed to AI, reflecting some early signs of labor market disruptions from this new technology.
Fewer workers and fewer jobs have put the labor market in the slow lane, with nonfarm payroll gains slowing to just 60,000 per month over the past six months. Meanwhile, unemployment rates have risen, even if these remain low from a historic standpoint.
Slow labor force growth looks very likely to persist into 2026, especially given the administration’s continued focus on immigration. There is some risk that this starts to trigger labor shortages in sectors that lean on immigrant workers, such as construction and agriculture.
Meanwhile, businesses should remain cautious around hiring as we move into 2026, but this might moderate through the year. Current hiring rates are running below those consistent with solid headline growth. If activity remains steady, as we expect, firms may need to bring in new staff to meet this demand.
Therefore, we should see the labor market stabilize as we move through 2026, with unemployment expected to trend around 4.5% next year. This stabilization should help alleviate concerns over the health of the economy, but the labor market will remain very much in the slow lane, with monthly payroll prints to remain in the 50,000 – 100,000 range.

This chart shows the trends in GDP growth and hours worked. The growth rates of these have aligned closely over the past 15 years, but more recently we have seen GDP growth clearly outpace hours worked.
This chart shows the trends in GDP growth and hours worked. The growth rates of these have aligned closely over the past 15 years, but more recently we have seen GDP growth clearly outpace hours worked.
We expect inflation to remain above the Fed’s target through 2026, supported by stable economic growth and lingering price pressures. However, we do not anticipate a major reacceleration, with headline inflation likely holding in the 2.5% – 3.0% range and showing modest improvement by year-end compared to 2025.
Tariffs have contributed to a pickup in goods prices, a trend likely to persist early in the year before fading by mid-2026. Absent another major trade escalation, we see tariffs as a one-off increase and a temporary driver of inflation.
Services inflation, which accounts for 75% of the core CPI basket, remains sticky but on a gradual path of moderation. A slowdown in home prices and rents suggests further downside in shelter inflation. Beyond housing, services inflation is heavily influenced by the labor market. While softening conditions — rising unemployment, fewer job openings and slower quits — should keep wage growth muted, structural constraints, such as lower immigration and an aging population, may keep wages above pre-pandemic levels. Longer term, productivity gains from AI could act as a disinflationary force, though this may simply offset pressures from high government spending and deglobalization.
Bottom line: Mixed pressures leave inflation steady — still above target, yet no worse than last year.

This chart shows the year-over-year change of headline and core CPI relative to the Fed's 2% target and the year-over-year change in goods versus services inflation. Core and headline CPI remain above the Fed's target. Services inflation is moderating slowly while goods inflation is rising from low levels.
This chart shows the year-over-year change of headline and core CPI relative to the Fed's 2% target and the year-over-year change in goods versus services inflation. Core and headline CPI remain above the Fed's target. Services inflation is moderating slowly while goods inflation is rising from low levels.
With CPI inflation likely slowing toward 2.5% – 3.0%, we see the Fed continuing its rate-cutting cycle in 2026. Importantly, this easing is driven by a cooling labor market and moderating inflation rather than an economic downturn. However, ongoing economic resilience and inflation remaining above target suggest the Fed easing cycle may be shallow from here.
In 2025, the Fed concluded its balance sheet reduction program, known as quantitative tightening. This step should help enhance liquidity by stabilizing bank reserves — deposits by banks at the Fed, widely regarded as among the highest-quality and most liquid assets in the banking system. We anticipate the Fed will resume expanding its balance sheet in 2026 to ensure adequate reserves, providing additional monetary support and serving as another form of policy easing.
The Fed’s preferred inflation gauge — core personal consumption expenditure (PCE) — typically runs slightly below CPI inflation, partly because it assigns a smaller weight to shelter, where prices have risen at a faster pace historically. PCE also accounts for changes in consumer behavior more quickly, such as substitution toward cheaper goods and services as prices rise. Consequently, core PCE could drift closer to 2.5% next year, and a neutral Fed policy rate is generally considered to be around 0.75% – 1% above inflation for the U.S.
While not our base case, upside risks to this outlook include the possibility that lingering inflation becomes entrenched or even accelerates — potentially spurred by tariffs feeding through to goods prices or higher wages pressuring services inflation — which could slow the pace of rate cuts. Conversely, a sharper labor-market slowdown could prompt the Fed to move more aggressively.
Overall, we expect cash yields to fall further toward the low 3% range as rate cuts progress. Some investors remain overweight in cash-like investments, including money market funds, which attracted significant inflows in recent years due to elevated yields. Cash offers important benefits, such as funds for unexpected expenses, short-term savings goals and everyday spending. However, holding too much can pose the risk of lower long-term returns. After evaluating how much cash you need, consider reinvesting excess cash into asset classes that may be underweight relative to your intended allocations to better align your portfolio with your financial goals.

This chart shows the federal funds rate since 2024 and market-implied expectations and Fed projections for it through 2026.
This chart shows the federal funds rate since 2024 and market-implied expectations and Fed projections for it through 2026.
In 2025, U.S. equity markets were led once again by technology and AI sectors. This marked the third year in a row that growth outperformed value, and sectors such as technology and communication services dominated the S&P 500 sector returns. And this growth leadership emerged despite the volatility we saw early in April 2025, when tariff uncertainty wreaked havoc on tech sectors.
The reason for the outperformance was relatively straightforward: Mega-cap technology firms delivered substantial upside to earnings growth in 2025 and reaffirmed strong outlooks for 2026. The key question for investors now is whether tech and AI can lead markets for a fourth year.
In our view, the answer lies largely in the earnings outlook for 2026. While technology and growth sectors substantially outpaced the rest of the market in terms of earnings growth in 2025, the year ahead may look different. Both tech and non-tech parts of the market are expected to deliver solid earnings, with forecasts pointing to positive earnings growth across all 11 S&P 500 sectors in 2026. In addition to technology and communication services, sectors such as financials, industrials and consumer discretionary are all expected to produce double-digit earnings growth.
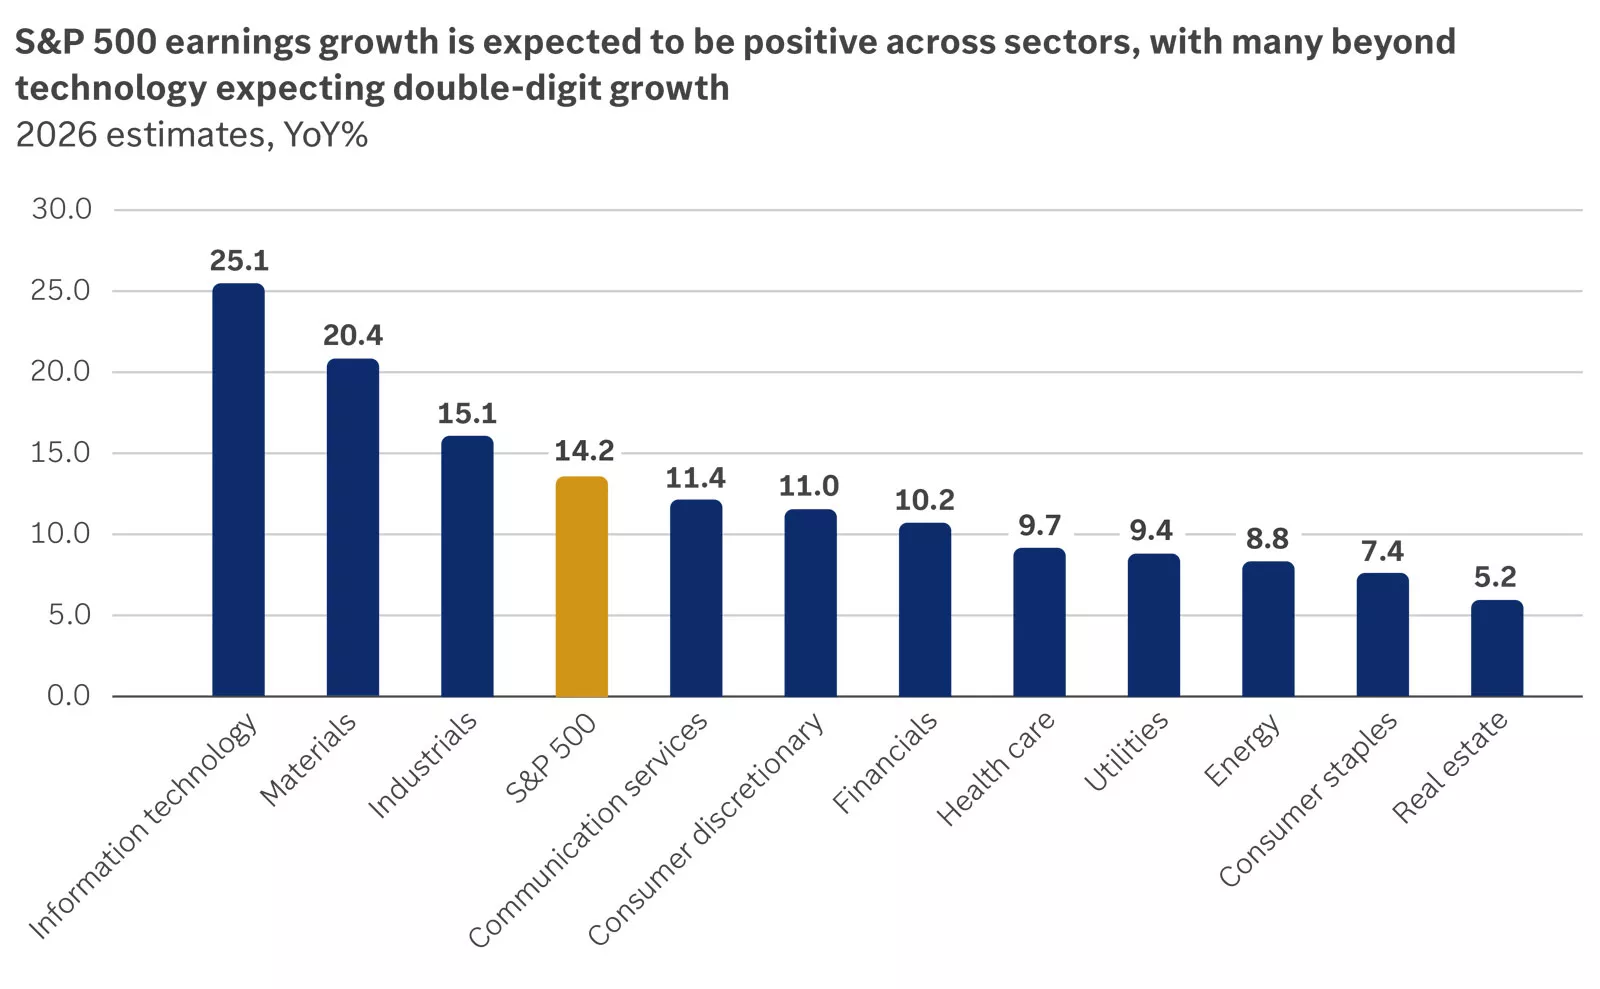
This chart shows that S&P 500 earnings growth in 2026 is expected to be positive across sectors, with many sectors beyond technology expecting double-digit growth.
This chart shows that S&P 500 earnings growth in 2026 is expected to be positive across sectors, with many sectors beyond technology expecting double-digit growth.
There are also some business model shifts worth monitoring in the mega-cap technology firms. While the growth rates and backlogs of these companies are still stellar, the pace of growth is coming down — and this second derivative may matter more in the year ahead. We could also see clear winners and losers emerge in areas such as AI chatbots or semiconductor chips. And many of the mega-cap technology firms are now taking on debt to finance the tremendous AI capex spending while becoming more asset-heavy, all of which may weigh on margins and valuations over time.
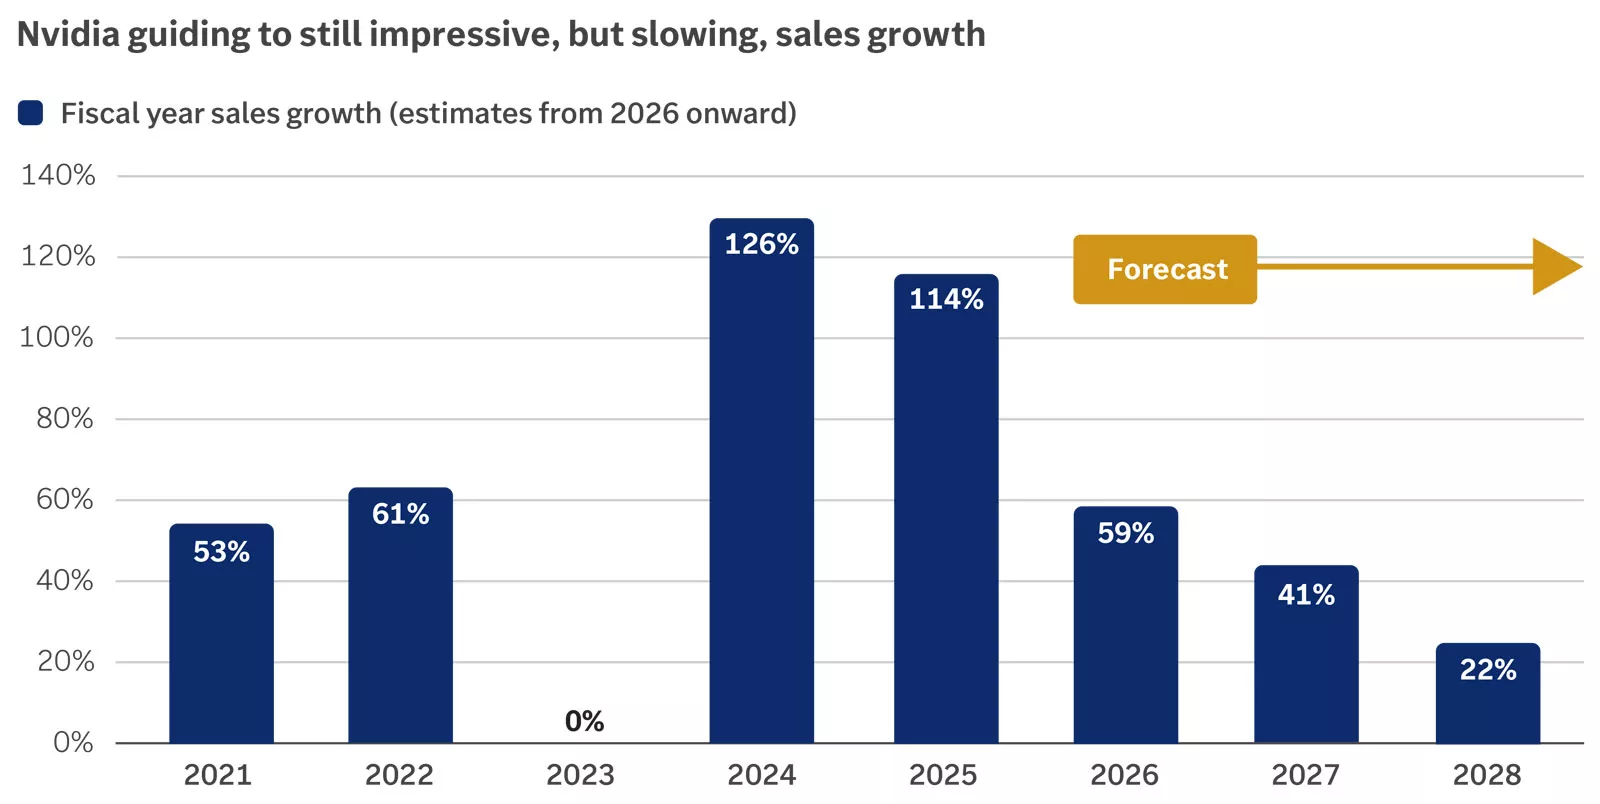
This chart shows that Nvidia's sales growth figures are expected to be positive, but slower in the years ahead.
This chart shows that Nvidia's sales growth figures are expected to be positive, but slower in the years ahead.
How do we think about portfolio positioning in this backdrop? In our view, given where we are in this cycle, the case for diversification in equity markets is more compelling in 2026. We favor U.S. large-cap stocks, which are exposed to the AI theme, alongside U.S. mid-cap stocks, which are more weighted toward cyclical sectors and have scope for catch-up, especially as the Federal Reserve potentially lowers interest rates. We also recommend looking globally, in emerging-market equities, which can do well when the Fed cuts rates and offer exposure to a global technology theme, as well as international small- and mid-cap stocks, which have relatively favorable valuations. Finally, we remain equal weight on growth and value, as we think value and cyclical-style equities can perform well alongside tech and AI baskets in the year ahead.
With the federal funds rate likely heading toward 3% - 3.5%, a positive yield curve should keep intermediate-term bond yields above this range. We expect the benchmark 10-year Treasury yield to remain largely within the 4.0% - 4.5% range in 2026.
We believe there are some guardrails in place around this range. Although 10-year yields could temporarily overshoot, we would expect them to drift back toward 4.0% - 4.5%. Additional Fed purchases of Treasury bills should help anchor the short end of the yield curve near the fed funds rate, likely limiting upside pressure on yields. Conversely, resilient economic growth, persistent budget deficits and inflation risks typically drive yields higher, making a sustained drop unlikely, in our view.
Despite pulling back from recent peaks, 10-year yields remain attractive — near the high end of their range since 2008, shown in the following chart. Higher yields mean bonds generate more income. Since Treasury bonds serve as the benchmark for most U.S. investment-grade bonds, elevated yields should provide a foundation for solid returns ahead, with most of the contribution coming from income rather than price appreciation.
On the credit side, credit spreads — the excess yield above Treasury bonds to compensate for default risk — have tightened well below historical averages. We see little room for further narrowing, and any potential widening could drive yields higher and bond prices lower. Resilient growth could provide a stable backdrop for credit conditions, allowing investment-grade credit spreads to remain relatively contained. High-yield bond spreads may be more susceptible to widening, as they are closer to historical lows and tend to be more sensitive to any weakening in credit conditions.
Further Fed rate cuts could widen the yield advantage of bonds over cash. Since yield is a key driver of fixed-income returns, this sets the stage for bonds to outperform cash again in 2026, as they have in 32 of the past 45 years. For perspective, since 1981, U.S. investment-grade bonds have generated annualized returns of 6.1%, compared with 4.1% for cash.
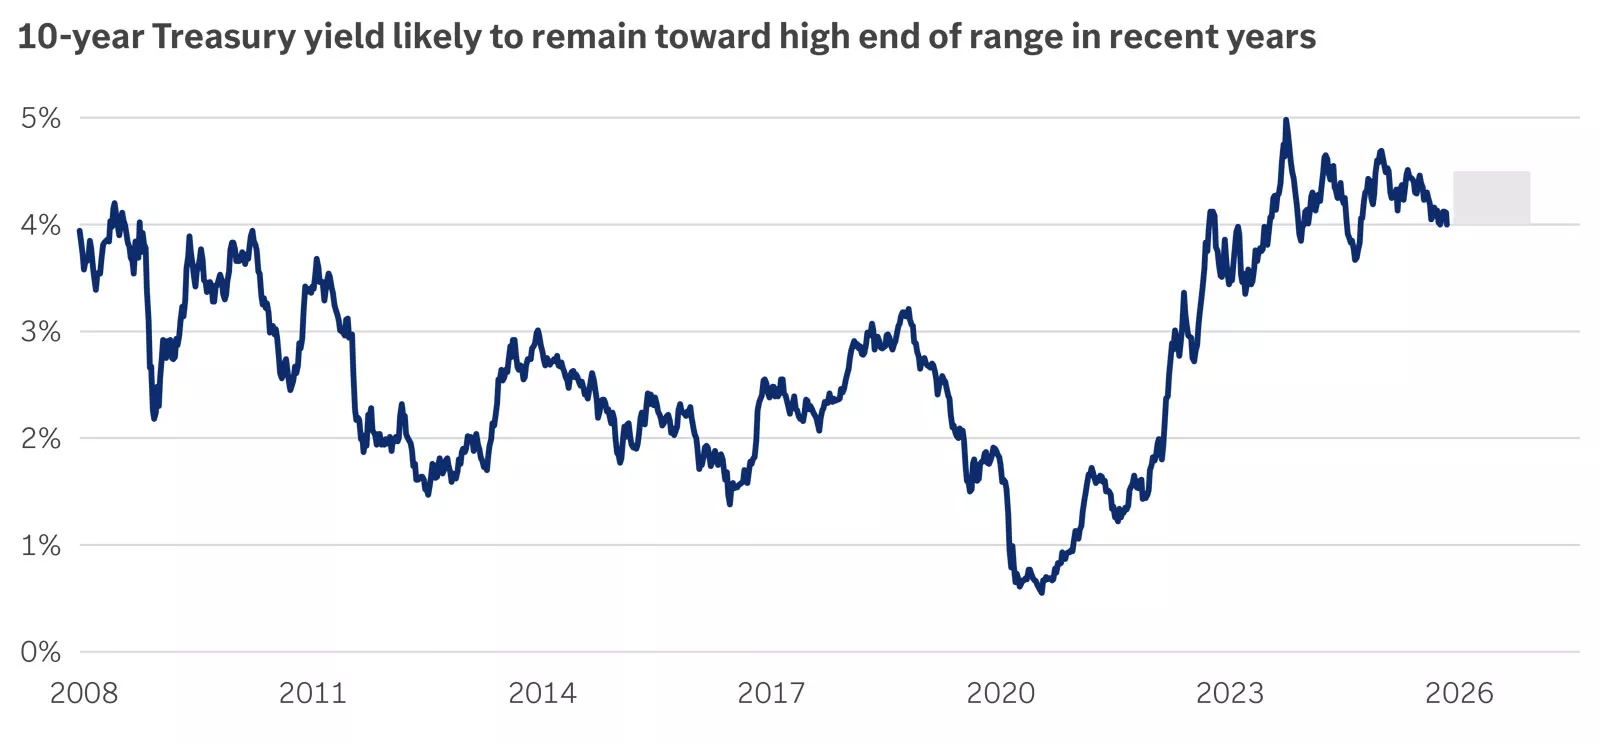
This chart shows the 10-year Treasury yield since 2005 and our expectations for 2026.
This chart shows the 10-year Treasury yield since 2005 and our expectations for 2026.
2025 was a strong year for international equities, with markets in Germany, France, the United Kingdom and Japan all reaching new all-time highs.1 We anticipate that 2026 will be another favorable year for global economies and markets, underscoring the importance of international diversification. While the robust performance of 2025 may be challenging to replicate, we believe there are compelling reasons to remain optimistic about international stocks in 2026.
Eurozone economies are beginning to benefit from the European Central Bank’s rate-cutting cycle, as evidenced by rising loan demand and improving business activity surveys.1 Furthermore, fiscal stimulus measures announced by Germany in the spring are expected to bolster economic activity in the eurozone’s largest economy throughout 2026. With the sharp rally in European equities during 2025 largely valuation-driven, we see potential for earnings growth to play a more prominent role in supporting equity markets this year.
In the United Kingdom, persistently high inflation has prompted a cautious approach to monetary easing by the Bank of England (BoE). However, with signs of labor market softening, the BoE may have room to continue easing policy in 2026, potentially supporting economic activity. Similar to the eurozone, the U.K. economy has shown signs of strengthening loan demand, and survey-based indicators of business activity have improved.1
Turning to Japan, despite demographic headwinds and U.S. auto tariffs, economic activity remained resilient in 2025 and could be further supported in 2026 by a pro-growth policy agenda under Japan’s new government.1 Notably, corporate governance reforms implemented over the past decade appear to be bearing fruit, with Japanese company profit margins reaching a 20-year high in 2025.2
Taken together, we believe international developed stocks merit an allocation within diversified portfolios. In our view, the combination of economic momentum in the eurozone, improving profitability among Japanese corporations, potential for accelerating earnings growth, and relatively attractive valuations — particularly among small-and mid-cap companies — supports the case for another year of positive returns in 2026. Additionally, with the S&P 500 heavily concentrated in the 10 largest companies, adding exposure to international developed markets can help manage risk, broaden opportunity sets and enhance long-term portfolio resilience.
Within emerging markets, economic activity in China has been subdued, with a battered property sector dampening consumer confidence and loan demand.1 Additionally, U.S. trade policy has contributed to sluggish manufacturing activity in the world’s second-largest economy, and trade tensions between the U.S. and China are likely to persist in 2026.
Nevertheless, we view emerging-market equities as a means of gaining exposure to the AI race at more attractive valuations versus the U.S. Additionally, emerging-market stocks have historically performed well in the periods following Federal Reserve interest rate cuts, which we believe creates a constructive backdrop for 2026.
1 Source: FactSet.
2 Source: FactSet, LTM net profit margin MSCI Japan Index.
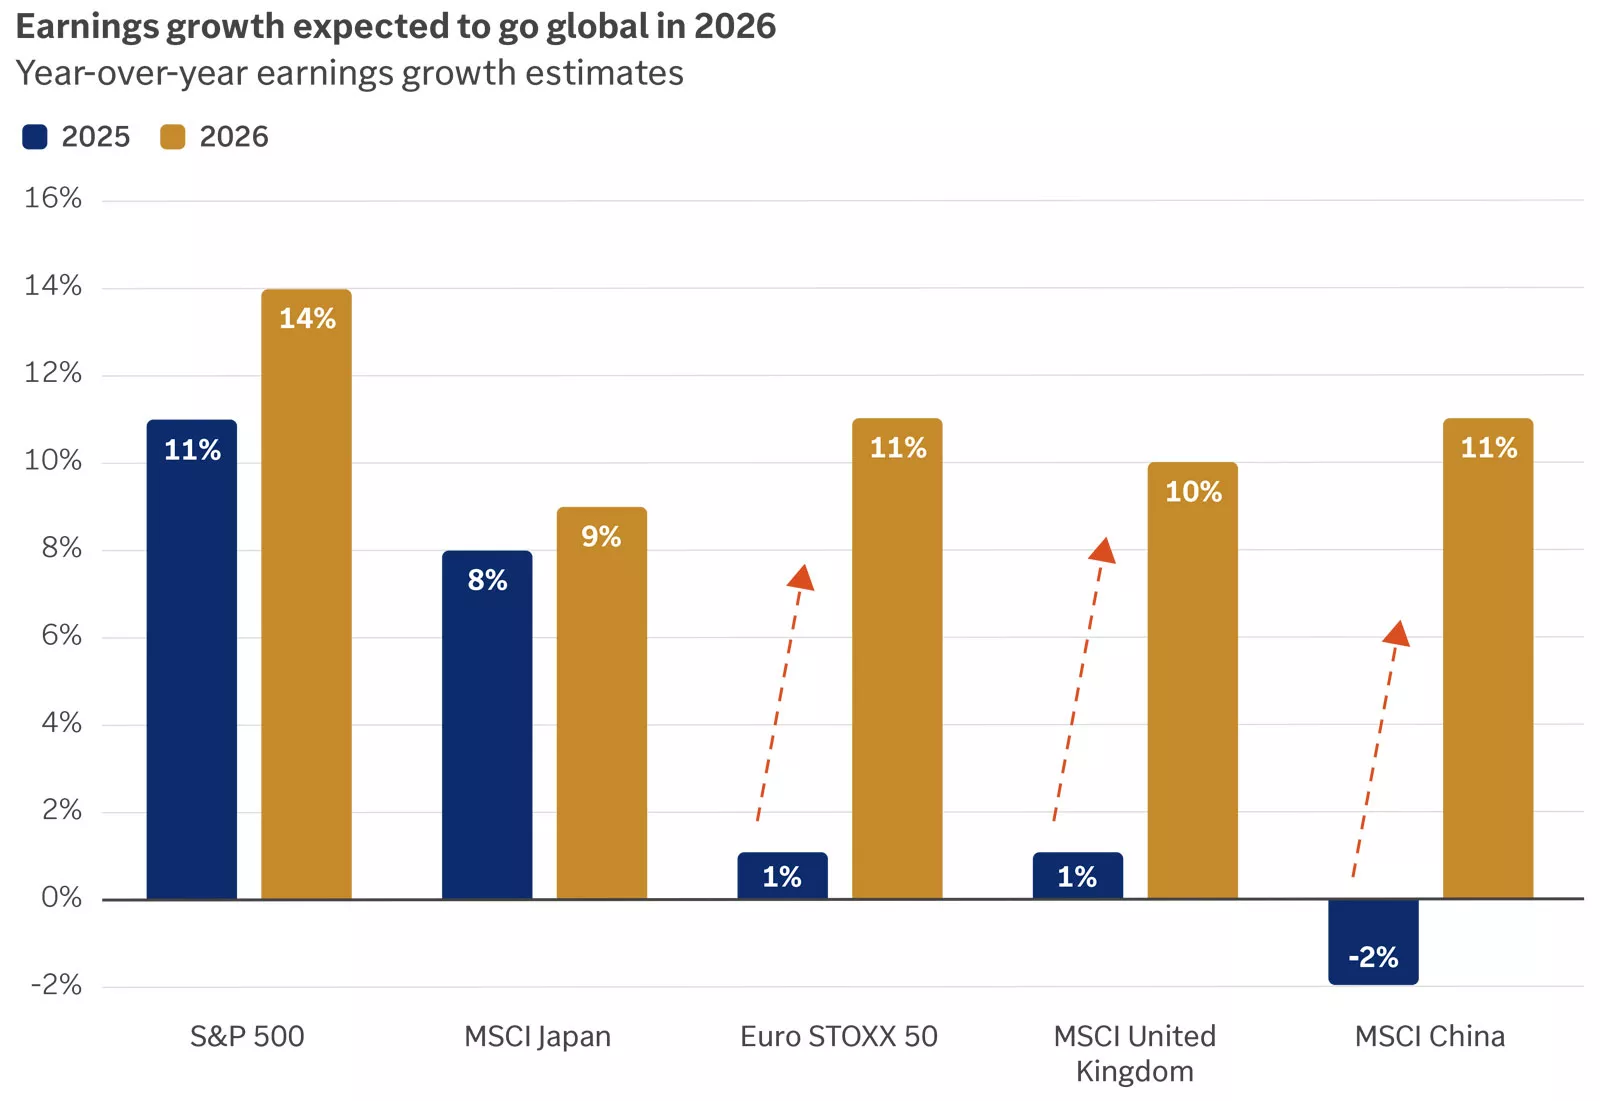
This chart shows earnings growth estimates for 2025 and 2026 for the S&P 500, MSCI Japan, Euro STOXX 50, MSCI U.K. and MSCI China Indices. Strong earnings growth across each of these regions is expected in 2026.
This chart shows earnings growth estimates for 2025 and 2026 for the S&P 500, MSCI Japan, Euro STOXX 50, MSCI U.K. and MSCI China Indices. Strong earnings growth across each of these regions is expected in 2026.
After a mostly uninterrupted 15-year bull market, the U.S. dollar came under pressure in 2025. Political and fiscal uncertainty, combined with a narrowing yield advantage versus other developed markets and increased currency hedging by foreign investors, contributed to the dollar’s decline. For investors, the weaker dollar provided meaningful support to international equity returns. However, the sharp fall early in the year reignited debate over whether the dollar is at risk of losing its status as the global reserve currency. In our view, the U.S. dollar’s central role in global trade and finance is unlikely to change in the foreseeable future. Nonetheless, we anticipate a flat-to-weaker dollar in 2026.
One way to assess global confidence in a currency is by examining its share of foreign exchange reserves — assets held by central banks in nondomestic currencies. In Q2 2025, the U.S. dollar accounted for 53.3% of global foreign exchange reserves, more than twice the share held in euros, the second-largest reserve currency.1 Additionally, the dollar has remained the dominant currency for international payments, accounting for approximately 50% of global transactions in 2024, up from about 30% in 2012.2 We believe the relative stability of the U.S. economy and its deep integration with global markets will support continued dollar dominance in the international financial system.
While we expect the dollar’s dominant role in global markets to persist, we see potential for a flat-to-weaker dollar in 2026. The U.S. yield advantage — across both short- and long-term maturities — has narrowed versus peers such as Japan and Germany.3 We anticipate further interest rate cuts by the Federal Reserve in 2026, while the European Central Bank appears to be at the end of its easing cycle and the Bank of Japan is expected to continue tightening into 2026.3 These divergent monetary policy paths could further erode the U.S. yield premium, placing modest downward pressure on the dollar.
For investors, currency effects are likely to play a less significant role in international returns in 2026 compared to the previous year. Nonetheless, with the U.S. yield advantage potentially diminishing and economic momentum improving in Europe, we maintain our outlook for a flat-to-weaker dollar in 2026 — reinforcing the case for maintaining a globally diversified portfolio.
1 Source: IMF Currency Composition of Official Foreign Exchange Reserves.
2 Source: Federal Reserve Board, “The International Role of the U.S. Dollar – 2025 Edition.”
3 Source: FactSet.
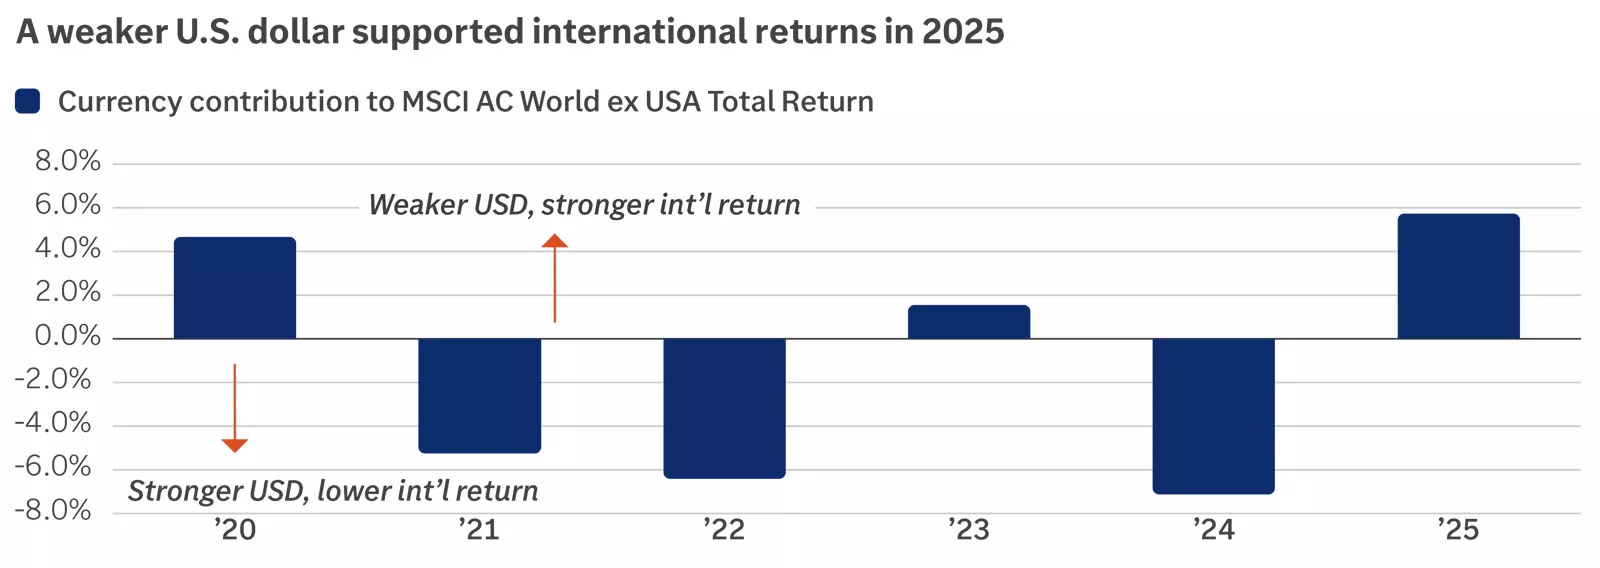
This chart shows the contribution of currency to the total return of the MSCI AC World ex USA Index. A weaker USD boosted international returns for U.S. investors in 2025.
This chart shows the contribution of currency to the total return of the MSCI AC World ex USA Index. A weaker USD boosted international returns for U.S. investors in 2025.
The Trump administration’s first year delivered the largest shakeup in tariff and trade policy in 100 years, a sizeable tax bill and a push to slash segments of the federal government. We expect 2026 to be quieter, but with the midterm elections in focus, we can’t rule out further fireworks.
One big question is whether Republicans use majorities in the House and Senate to pass another reconciliation bill, potentially to enact $2,000 tariff rebate checks for lower- and middle-income households. Given an already stretched deficit, we suspect lawmakers might balk at the $600 billion price tag of this giveaway, but further stimulus could be attractive in an election year.
On tariffs, the Supreme Court will rule whether the President overstepped his authority when using emergency powers to implement them. This decision may be less impactful than investors fear, as the President possesses a range of tools to raise tariffs should the emergency route be deemed unconstitutional.
More important will be any further shifts in tariff rates themselves. Following dramatic changes this year, we think rates will be more stable in 2026, with potential adjustments in bilateral tariffs, and for specific sectors, expected to drive only moderate adjustments in aggregate U.S. trade policy.
One important dynamic to watch will be the renegotiation of the USMCA trade agreement between the U.S., Canada and Mexico. This has shielded much of the trade across North America from higher tariff rates, and while grandstanding around the deal is to be expected, we think changes to the agreement will be modest.
Otherwise, policy changes started in 2025 will likely gain traction next year, with new leadership appointments across a range of government agencies to deliver more tangible deregulation. President Trump will also get the chance to appoint a new Fed chair, although we should be careful not to overstate the role this individual will play in setting policy as part of a 12-voting-member FOMC rate-setting committee.
It is too early to make any strong predictions over the midterm elections, although it is common to see incumbent parties struggle in these polls. Should Republicans lose one or both of their majorities in Congress, we could see political gridlock take hold in 2027 and 2028, reflecting the sparsity of bipartisan consensus in the current climate.
However, while everyone will have their view on politics, it is important to emphasize we would not recommend playing politics with your portfolio. Stock markets can perform well across a four-year presidential cycle regardless of the party in power, with important themes detached from political headlines — such as the AI revolution, corporate profitability and economic fundamentals — critical for markets. Moreover, while we have seen generally lower average returns during midterm years, these have been typically followed by more robust gains the following year.
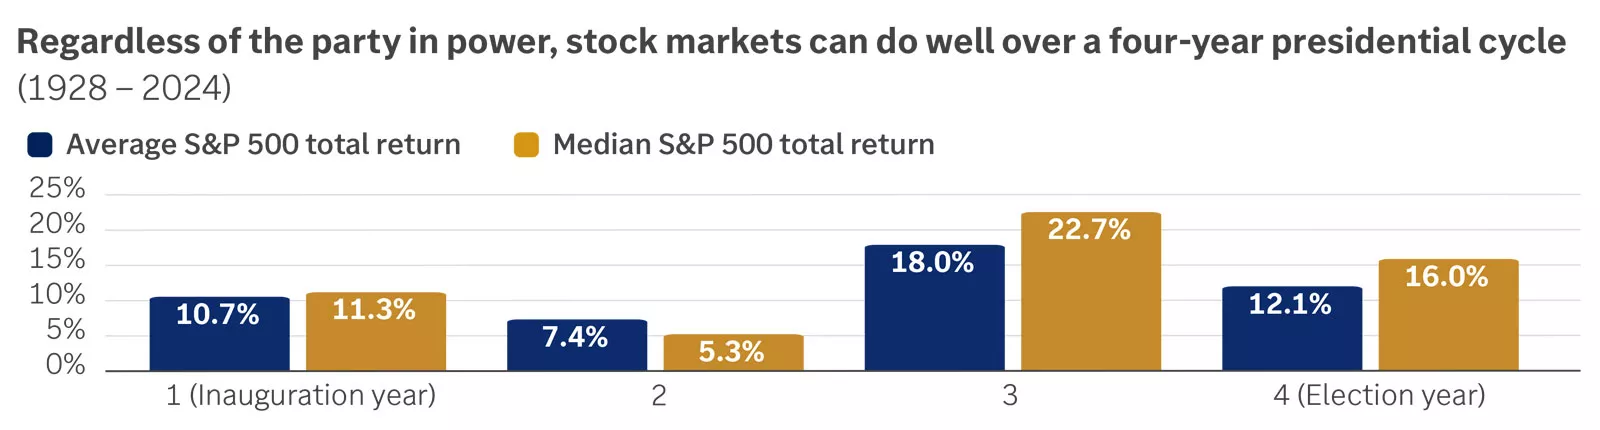
This chart shows the return of the S&P 500 index by year of the presidential election cycle.
This chart shows the return of the S&P 500 index by year of the presidential election cycle.
Our base case for 2026 calls for a relatively benign year: steady economic growth, modest fiscal stimulus, lower interest rates and rising corporate profits, all of which provide a supportive backdrop for financial markets. However, it is certainly worthwhile to highlight where our team sees the biggest tail risks and potentially disruptive forces for this scenario. The three biggest risks that could test market resilience in our view are AI disappointments, an inflation surprise and credit stress.
AI represents one of the most transformative technological advances in recent history and has already shaped market performance, with U.S. mega-cap technology stocks driving much of the bull market’s gains. Yet after a historic three-year rally, with the top 10 stocks now accounting for over 40% of the S&P 500’s market capitalization, questions are emerging about whether AI can deliver sufficient productivity and profit growth to justify heavy investment.
There are a few ways the mega-cap technology companies could disappoint investors. First, if AI adoption fails to meet expectations or the growth rates of these companies slow faster than forecast, optimism could fade, weighing on tech leadership and broader equity valuations. Second, a handful of winners could emerge across the AI space, which may put pressure on the secondary and tertiary players in the industry. Finally, as noted, many mega-cap technology companies are taking on debt to finance the large rise in AI capex spending, which could weigh on margins and stock multiples over time. In our view, maintaining exposure to innovation while avoiding overconcentration is critical in the year ahead.
A second risk to the outlook is an unexpected acceleration in inflation — beyond our base case of 2.5% – 3.0% headline CPI inflation — which would potentially halt the Fed’s rate-cutting cycle and put pressure on real wages. Inflation could be driven by rising goods inflation, which may occur if companies ultimately decide to pass higher tariff-related costs on to consumers. Or inflation could be driven higher by rising services inflation, which makes up about two-thirds of the CPI basket, perhaps caused by a tight labor market and rising wage pressure. In addition, any new policies that increase fiscal stimulus by means of stimulus checks or other government rebates could stoke the flames of inflation as well. For investors, the best guardrails against inflation in our view are investments in assets that outpace inflation rates over the long run, including allocations to a diversified set of equities and bonds.
Finally, a third potential risk to the outlook could come from stress in the credit markets, either public or private credit. Credit spreads in U.S. investment-grade and high-yield bonds remain tight, although they have been drifting higher. If we see a sharp rise in credit spreads, perhaps driven by concerns of defaults in parts of AI or other sectors, this could spark a broader disruption in financial markets. Similarly, private credit, which has been a rapidly growing income-generating segment of private markets, also remains vulnerable if higher-for-longer rates trigger defaults. While stress in both public and private credit markets has remained contained this cycle, an upheaval in these markets could amplify market volatility and tighten financial conditions. We continue to maintain a slight overweight to equities over bonds, and within the bond space, we recommend a diversified basket of investment-grade, high-yield, emerging-market and international bonds alongside appropriate allocations to cash positions.
Overall, we continue to believe that AI is not in a bubble, earnings will deliver, inflation can remain contained in the 2.5% – 3.0% range and credit markets will be benign in the year ahead. Nonetheless, if tail risks emerge to challenge these views, we believe investors who remain well diversified — across asset classes, sectors and geographies — can be best positioned to outperform.
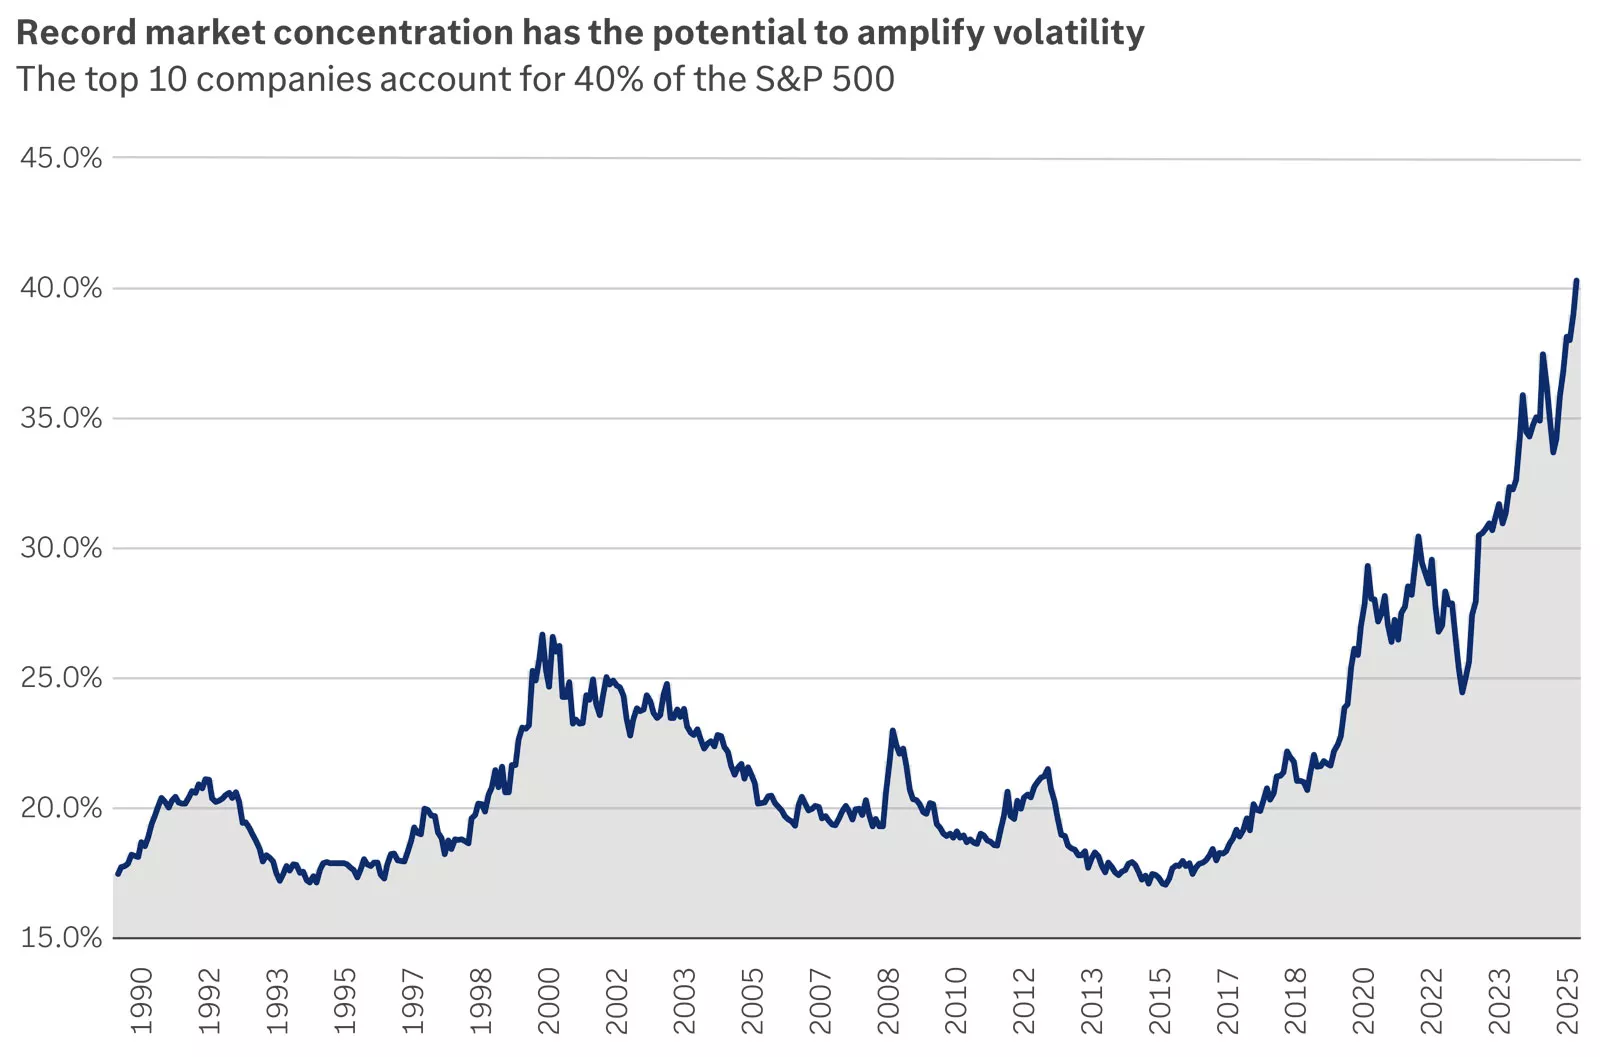
The graph shows that the top 10 companies of the S&P 500 by market capitalization now account for 40% of the index, a record concentration.
The graph shows that the top 10 companies of the S&P 500 by market capitalization now account for 40% of the index, a record concentration.
Planning strategies for 2026
As we enter 2026, now is the time to review your financial strategy. The volatility of 2025 — marked by tariffs, concentrated tech-sector growth, the longest government shutdown in U.S. history and the passage of the One Big Beautiful Bill Act (OBBBA) — may have impacted your plan. Assessing your situation now can help you capitalize on new tax legislation and position yourself for success.
A financial checkup is crucial to staying on track and monitoring progress toward your goals.
- Budget — Inflation has eased in some areas but remains elevated in many others. Conduct a thorough budget review. If you’re not on track, identify opportunities to reduce your spending (or increase your income) to help ensure you’re not compromising your long-term objectives.
- Emergency fund — While we may have expectations for what the new year will bring, we also know there will be surprises. Check to make sure your emergency fund is in line with your needs. We recommend having three to six months’ worth of total expenses in cash or cash equivalents set aside for emergencies.
- Debt management — Higher interest rates may have increased your borrowing costs. Make sure you’re building minimum payments for your debt into your budget. Where possible, consider making extra payments to pay down high-interest debt. As rates decline, explore refinancing options, which could include moving from a variable to a fixed-rate loan.
- Property/casualty coverage — As home prices have increased, you may be underinsured. Review your coverage and consider bundling policies or comparison shopping to lower premiums without compromising on coverage.
- Life insurance coverage — Assess your life insurance to ensure it aligns with your current needs. Life changes often require updated coverage to maintain adequate protection.
- Fraud/cybersecurity — Fraud and cyber threats are increasing. Educate yourself on red flags that you may be getting scammed. Enable multifactor authentication (MFA), use strong and unique passwords for each website and consider using a reputable password manager to help protect your financial accounts.
With contribution limits increasing, this year brings additional opportunities to save on a tax-advantaged basis for retirement and health care.
- Higher contribution limits — The beginning of the year is a good time to reassess how much you’re saving for retirement. At a minimum, contribute enough to receive any company matches. Then consider increasing your contribution rate by at least 1% each year to progress toward the next savings milestone. Some plans even offer a feature that will automatically do this for you. And if your goal is to maximize your retirement contributions, be sure to adjust your contribution amounts to take advantage of this year’s higher limits.
High-income earners catch-up contribution rule — If you’re age 50 or older and your wages exceeded $150,000 in 2025, you’ll only be able make Roth (after-tax) catch-up contributions in your workplace retirement plan this year. This includes 401(k), 403(b) and governmental 457(b) plans. While you may not get an immediate tax benefit from your plan catch-ups, you should generally still make them if you originally planned to. Roth contributions offer the potential for tax-free income in retirement and a tax-free legacy for your heirs.
Contribution type 2025 contribution limit 2026 contribution limit IRA contributions - Below age 50: $7,000
- Age 50 or older: $8,000
- Below age 50: $7,500
- Age 50 or older: $8,600
Elective deferral to 401(k), 403(b),1 governmental 457(b)2 - Below age 50: $23,500
- Age 50 or older: $31,000
- Age 60–63: $34,750
- Below age 50: $24,500
- Age 50 or older: $32,5003
- Age 60–63: $35,7503
Elective deferral to SIMPLE plans4 - Below age 50: $16,500
- Age 50 or older: $20,000
- Age 60–63: $21,750
- Below age 50: $17,000
- Age 50 or older: $21,000
- Age 60–63: $22,250
Health Savings Account (HSA) - Individual coverage: $4,300
- Family coverage: $8,550
- Age 55 or older (catch-up): $1,000
- Individual coverage: $4,400
- Family coverage: $8,750
- Age 55 or older (catch-up): $1,000
1 Additional service-based catch-up contributions may be permitted. Consult your plan administrator.
2 Limit applies to combined employee and employer contributions.
3 If your wages exceeded $150,000 in 2025, the catch-up amount ($8,000 for those age 50 and older, or $11,250 for those age 60-63) must be a Roth contribution.
4 Certain plans can contribute 110% of contribution limits. Consult your plan administrator.
- The One Big Beautiful Bill Act (OBBBA) — OBBBA, signed into law on July 4, 2025, significantly changed the federal tax landscape. It permanently extended many of the Tax Cuts and Jobs Act (TCJA) provisions and introduced new deductions and changes to itemized deductions and tax credits. Talk with your financial advisor and tax professional to determine how OBBBA might affect your personal situation. For detailed guidance, see our reports:
- The One Big Beautiful Bill Act: A summary of key tax provisions
- 2026 tax changes: What you need to know
- Review federal tax withholding — Use the IRS Tax Withholding Estimator (irs.gov/individuals/tax-withholding-estimator) or get advice from your tax professional on how (and how much) to adjust your withholding or tax payments this year. If your income is difficult to predict, you might even want to do this twice a year (once earlier in the year using estimates and once later when you’re more confident about your taxable income).
- Qualified charitable deduction (QCD) — In 2026, individuals age 70½ or older can exclude up to $111,000 of QCDs from taxable income.
- Beneficiary designations and asset titling — Accurate titling is critical to execute your estate plan. Review your beneficiary designations and asset titling to ensure they’re up-to-date and align with your intended plan.
- Annual gifts — The annual gift tax exclusion is $19,000 for 2026. Incorporating annual gifts into your plan provides additional gifting opportunities beyond your gift and estate lifetime exemption.
- Communicate — It’s essential to inform those you have named in your documents of their roles and responsibilities to ensure they’re comfortable acting in their named capacity. To the extent you’re comfortable, share your plan with loved ones, as it allows you to communicate and clarify your intentions and address questions
A proactive review helps you prepare for evolving markets, respond to regulatory changes and track progress toward your financial goals. Work with your financial advisor and professional team to determine which of the above items make sense for your situation. Having a plan and solid commitment to execute can help better position you to achieve your goals.
Portfolio roadmap: 4 steps to stay ahead in 2026
2026 will likely deliver its share of attention-grabbing headlines, particularly as markets grapple with ongoing AI dynamics and evolving economic policies. But resilient portfolios aren’t built on reaction. They’re built on strategy. In a year offering a broad set of opportunities, global diversification should remain the cornerstone of that strategy, enabling your purpose to lead you through 2026 with clarity and discipline.
Therefore, revisit your comfort with risk, time horizon and financial goals. These factors should guide the creation of globally diversified asset allocation targets for your investment strategy — beginning with an appropriate mix of stocks and bonds aligned with your risk and return objectives. When supported by disciplined rebalancing, your strategic targets can help keep your portfolio goal focused and your emotions in check, no matter the surprises 2026 may bring.
While periodic volatility should be expected, the bigger picture appears constructive: modest fiscal support, easing central-bank policies, ongoing tech innovation, earnings growth and a steady economy provide a solid foundation for stocks to outperform bonds. With your strategic allocations as a starting point, consider overweighting stocks to capture timely opportunities.
We also expect the supportive backdrop to drive broadening market leadership, expanding investment opportunities across regions, styles and sectors. Therefore, given its value in helping to manage valuation, concentration, currency and interest-rate risks, among others, global diversification is critical to building a solid portfolio in 2026, including within overweight stock positions.
Here’s how we suggest striking the right balance:
- Favor U.S. large- and mid-cap stocks. We prefer the higher quality of these larger U.S. stocks as well as the exposure they provide to tech-related tailwinds alongside other sectors with relatively attractive valuations and catch-up potential, particularly amid the likelihood for deregulation and an improving policy backdrop.
- Favor more cyclical international stocks. Overweighting emerging-market stocks and international developed small- and mid-cap stocks can help portfolios tap further into policy tailwinds, technological breakthroughs and relatively compelling valuations more globally. Resilient global growth is also likely to boost the momentum of these economically sensitive asset classes more than international large-cap stocks, which we recommend underweighting.
- Reallocate from a blend of bond investments. When shifting toward stocks, consider underweight positions in a combination of bond asset classes. This can help manage risk during periodic volatility, especially given diverging interest rates across regions and historically low credit spreads within lower-quality bonds.
Tech sectors across multiple regions have dominated in recent years, driven largely by the growth prospects of AI, robust earnings and significant capital investments. However, this outperformance can lead to concentration risk as other sectors lag. If your portfolio has become overly exposed to top-performing sectors, consider rebalancing to help manage risks and capture a healthier mix of opportunities.
Complement tech exposure with opportunities across defensive, cyclical and growth sectors. We specifically favor the industrials, consumer discretionary and health care sectors, which are likely to benefit from a steady economy, the buildout of AI technology, easing policy risk and/or relatively attractive valuations
Even with an underweight stance on bonds, we believe they continue to play an important role for investors seeking income and can provide stability and diversification benefits when complementing a stock portfolio. Consider their role in your portfolio, managing allocations appropriately.
With the potential for interest rate volatility as markets evaluate the path of inflation, labor markets and monetary policy, consider a balanced mix across short-, intermediate- and long-term maturities. While U.S. bonds are core to a fixed-income portfolio, allocating to international bonds in developed and emerging markets can help manage interest rate risks more globally.
Given our expectation for additional easing by the Federal Reserve — likely pushing short-term rates lower — consider reducing overweight cash allocations to help limit reinvestment risk. Deploying that cash into allocations that have become too underweight can help unlock greater long-term return potential and more closely align your portfolio with your financial goals.
Talk with your financial advisor about our outlook, which drives our timely portfolio guidance. Consider how incorporating this guidance into your portfolio could help you move forward in 2026.
Opportunistic portfolio guidance
Our opportunistic asset allocation guidance represents how we recommend positioning your portfolio across asset classes based on current market conditions and our global outlook, while helping you stay appropriately diversified and within your comfort with risk. A neutral position indicates we recommend aligning your portfolio with your long-term strategic target allocations.
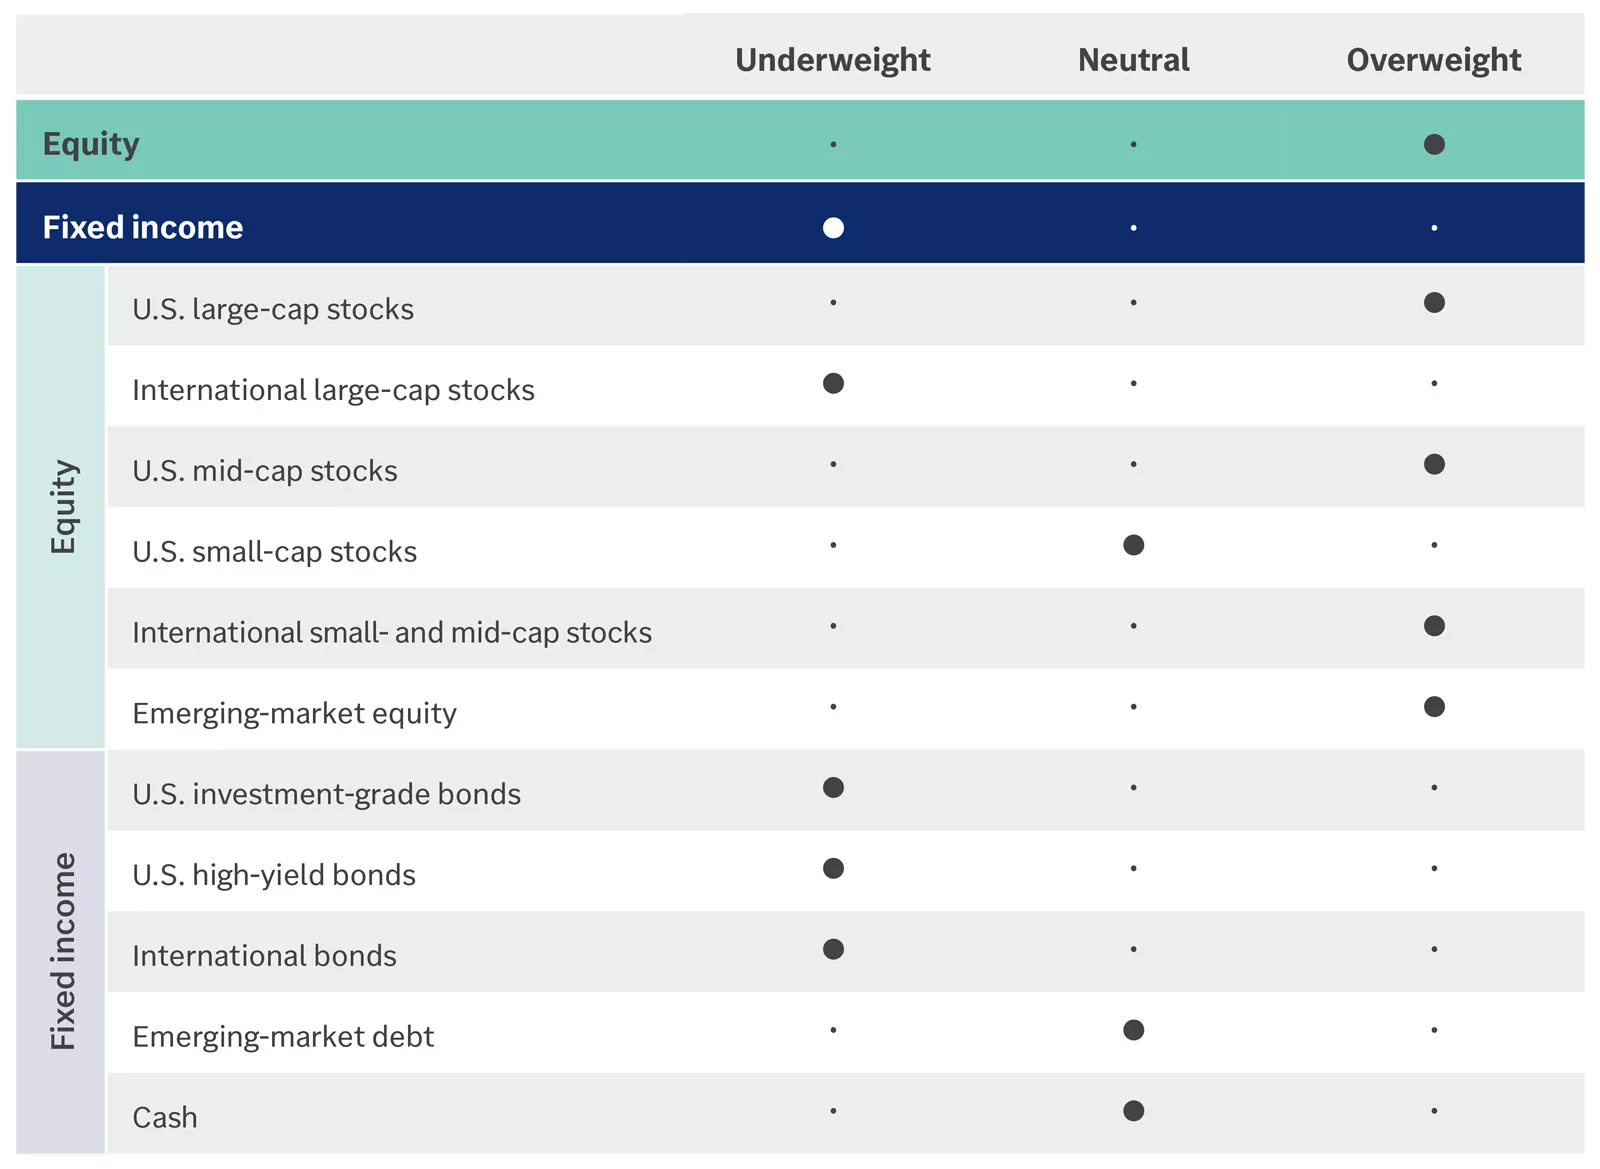
Our opportunistic asset allocation guidance follows: Equity — overweight overall; overweight for U.S. large-cap stocks, U.S. mid-cap stocks, international small- and mid-cap stocks and emerging-market equity; neutral for U.S. small-cap stocks; underweight for international large-cap stocks. Fixed income — underweight overall; neutral for emerging-market debt and cash; underweight for U.S. investment-grade bonds, U.S. high-yield bonds and international bonds.
Our opportunistic asset allocation guidance follows: Equity — overweight overall; overweight for U.S. large-cap stocks, U.S. mid-cap stocks, international small- and mid-cap stocks and emerging-market equity; neutral for U.S. small-cap stocks; underweight for international large-cap stocks. Fixed income — underweight overall; neutral for emerging-market debt and cash; underweight for U.S. investment-grade bonds, U.S. high-yield bonds and international bonds.
Our opportunistic equity style guidance represents how we recommend positioning between value- and growth-style equity within U.S. stock asset classes and the international large-cap stock asset class based on current market conditions and our global outlook.
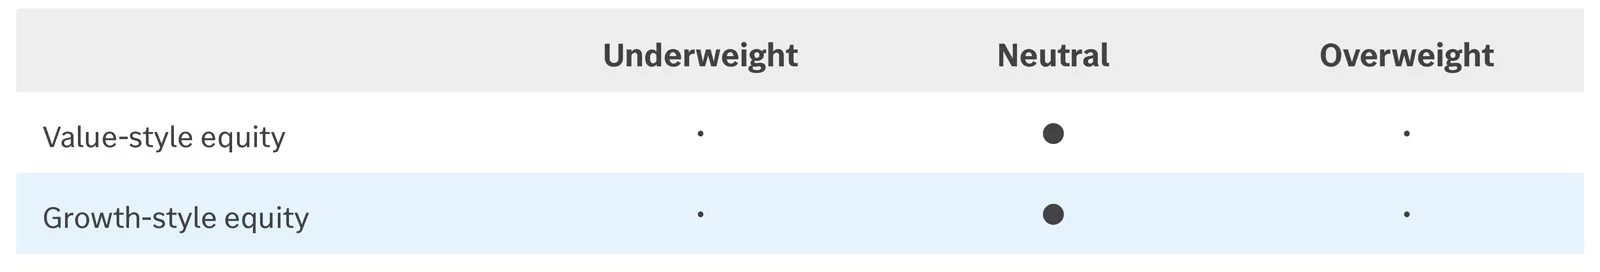
Our opportunistic equity style guidance is neutral for value-style equity and growth-style equity.
Our opportunistic equity style guidance is neutral for value-style equity and growth-style equity.
Our opportunistic equity sector guidance represents how we recommend positioning across sectors within the U.S. equity allocations of your portfolio based on current market conditions and our global outlook over the next six to 12 months. The guidance is relative to the sector weights of the S&P 500.
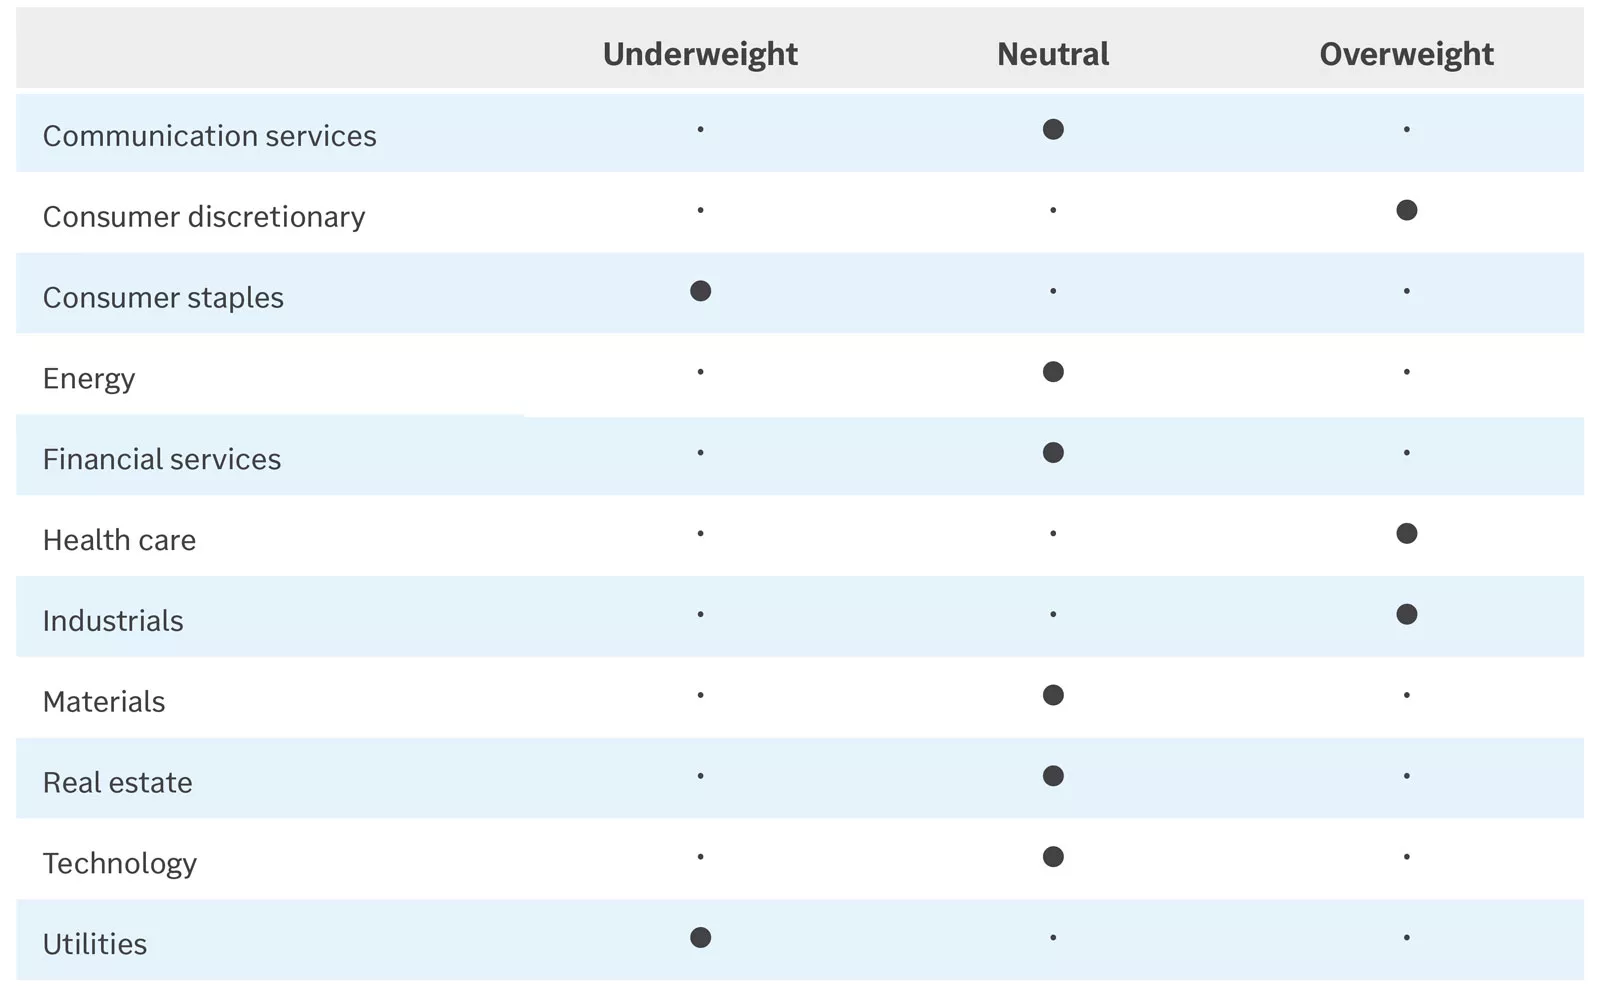
Our opportunistic equity sector guidance follows: Overweight for consumer discretionary, health care and industrials. Neutral for communication services, energy, financial services, materials, real estate and technology. Underweight for consumer staples and utilities.
Our opportunistic equity sector guidance follows: Overweight for consumer discretionary, health care and industrials. Neutral for communication services, energy, financial services, materials, real estate and technology. Underweight for consumer staples and utilities.
Our opportunistic U.S. investment-grade bond guidance represents how we recommend positioning across maturities and sectors within your higher-quality bond allocations, relative to the Bloomberg U.S. Aggregate Bond Index. Longer-term bonds generally carry more interest rate risk than shorter-term bonds. Corporate bonds have more credit risk than U.S. government bonds.
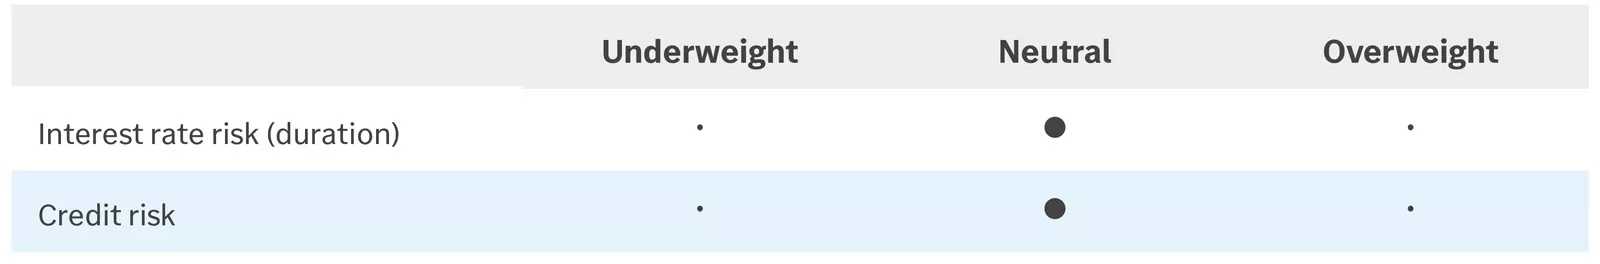
Our opportunistic U.S. investment-grade bond guidance is neutral in interest rate risk (duration) and credit risk.
Our opportunistic U.S. investment-grade bond guidance is neutral in interest rate risk (duration) and credit risk.
Investment performance benchmarks

The asset class return chart shows the total return for eleven different asset classes for Q4 2025, year-to-date, 3-year annualized, and 5-year annualized time horizons.
The sector return chart shows the total returns for the eleven U.S. large-cap sectors for Q4 2025, year-to-date, 3-year annualized, and 5-year annualized time horizons.
*Returns through 12/31/25
Investment Policy Committee
The Investment Policy Committee (IPC) defines and upholds Edward Jones investment philosophy, which is grounded in the principles of quality, diversification and a long-term focus.
The IPC meets regularly to talk about the markets, the economy and the current environment, propose new policies and review existing guidance — all with your financial needs at the center.
The IPC members — experts in economics, market strategy, asset allocation and financial solutions — each bring a unique perspective to developing recommendations that can help you achieve your financial goals.
Important Information:
Past performance of the markets is not a guarantee of what will happen in the future.
Investors should understand the risks involved in owning investments, including interest rate risk, credit risk and market risk.
The value of investments fluctuates, and investors can lose some or all of their principal.
Diversification does not ensure a profit or protect against loss in a declining market.
This material is for general information purposes only and is not intended to predict or guarantee the future performance of individual securities, market sectors or the markets generally. Opinions expressed are as of the date of this report and are subject to change. This material should not be interpreted as specific recommendations or investment advice for any particular investor or potential investor. Investors should make investment decisions based on their unique financial situation.