Markets take a breather as earnings outlooks come to the forefront
Key Takeaways:
- Market leadership is rotating. After a strong rally earlier this year, we are seeing a pullback in AI-related areas, like semiconductors, while cyclical and defensive sectors are leading more recently. While sector rotations may be ongoing, investors continue to stay invested, which has supported broader markets.
- Earnings season will be a key test for the AI trade. The S&P 500 second quarter earnings season is underway, and expectations remain high. Growth in the technology sector is forecast to be about 63%, contributing over 50% of overall S&P 500 earnings growth. Investors will be monitoring AI capex growth forecasts, and what the return on this investment could look like.
- The Fed is likely to keep interest rates on hold this year but will be monitoring data closely. With inflation elevated but contained and the labor market stable, the most likely outcome is that the Federal Reserve keeps interest rates unchanged this year. This could provide a relatively steady backdrop for earnings growth and equity markets.
Stock market rotations at the sector level, and within sectors
After a near 11% rally this year, the S&P 500 took a breather this week, down over 1%. Underneath the surface, markets are seeing more rotation, both among sectors and within sectors.
At the sector level, we have seen AI-driven sectors like technology underperform, while more cyclical and defensive areas have held up better. This has been the case not only over the last week, but since early June.
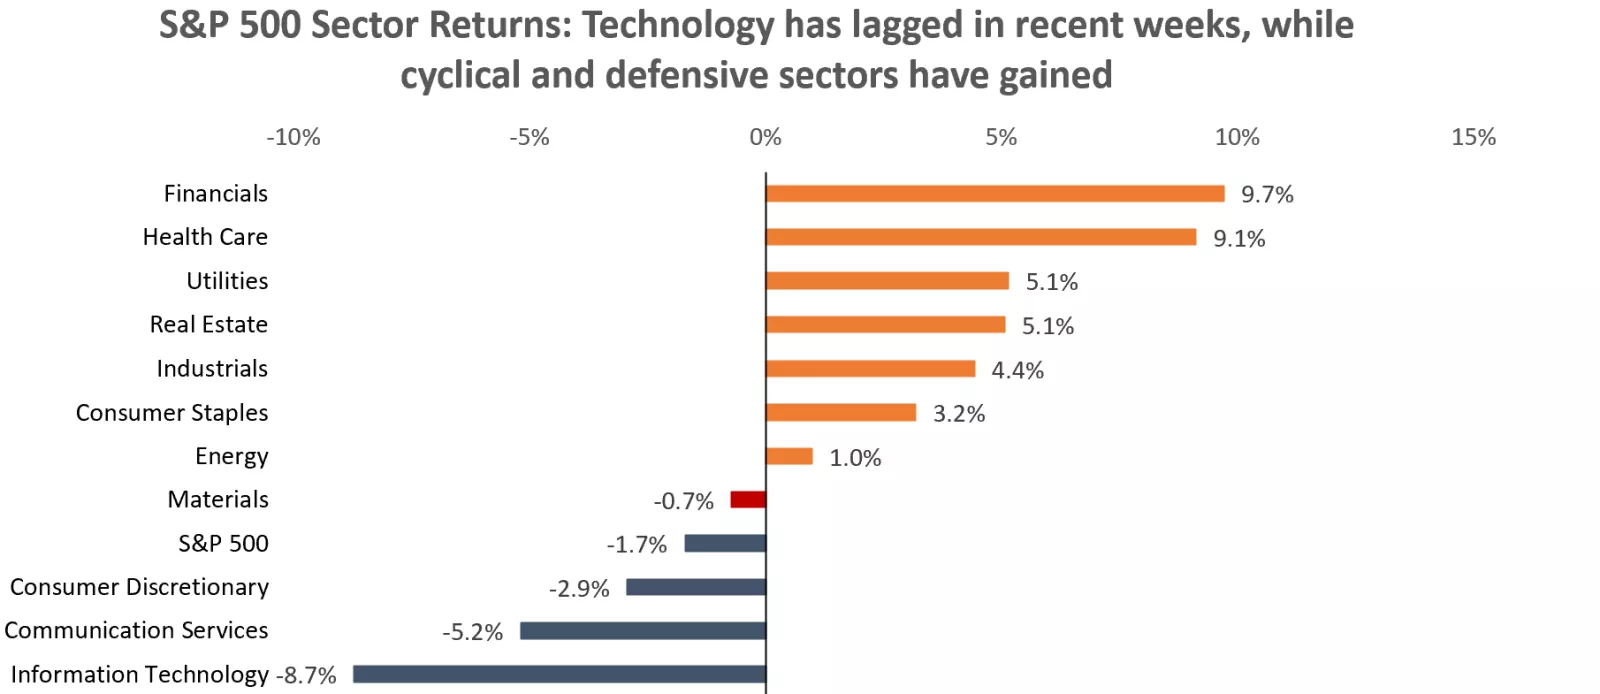
The chart shows that technology returns have lagged in recent weeks, while cyclical and defensive sectors have gained. Past performance does not guarantee future results.
The chart shows that technology returns have lagged in recent weeks, while cyclical and defensive sectors have gained. Past performance does not guarantee future results.
The parts of the market that had the sharpest rallies earlier this year, including semiconductor stocks, have seen the biggest pullbacks as well. This is not too surprising, given that parabolic moves in the market tend not to be sustainable – as there is some natural profit-taking and consolidation that brings these sub-sectors down again.
Keep in mind however that despite the recent pullback and rotation, many of these sectors are still up for the year. For example, the SOX Semiconductor index is down about 20% from its June highs but is still higher by around 64% for the year.
Within the technology sector, we are also seeing somewhat of a rotation. The semiconductor and hardware parts of tech are lagging, while the software and cloud sectors seem to be recovering. Names like Microsoft and SalesForce are rebounding, while AI infrastructure stocks are lagging.
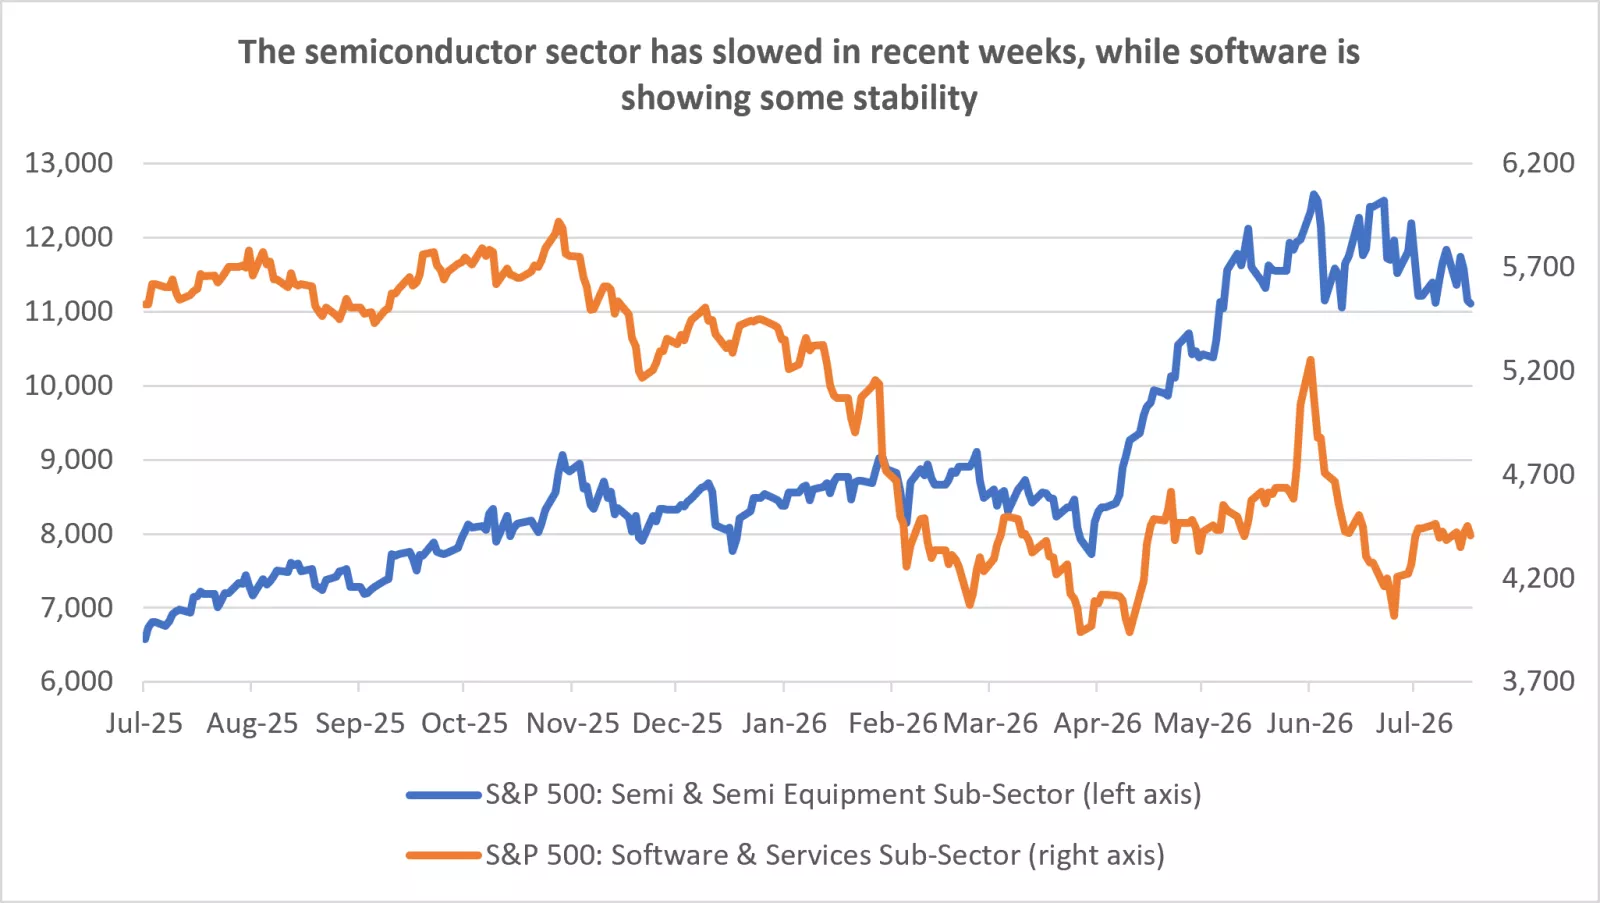
The chart shows that the semiconductor sector has slowed, while software is showing some stability. Past performance does not guarantee future results.
The chart shows that the semiconductor sector has slowed, while software is showing some stability. Past performance does not guarantee future results.
Bottom line: Parts of the technology sector, like semiconductors, had perhaps run too far, too fast, and are now giving back some of these gains. In our view, while the fundamentals of the story remain in-tact, with strong revenue, earnings, and backlogs, some of this good news may be reflected in the price already. Nonetheless, if earnings season delivers on lofty forecasts and the outlooks remain robust, we may see tech resume its leadership, especially in parts of the market that have lagged most.
All eyes on earnings season
Earnings growth has been a bright spot for corporations all year. As we enter Q2 earnings season, S&P 500 earnings growth forecasts have been revised substantially higher, from about 14% year-over-year to currently around 25%. The upward revisions have been driven mostly by the energy and technology sectors and have supported stock market gains.
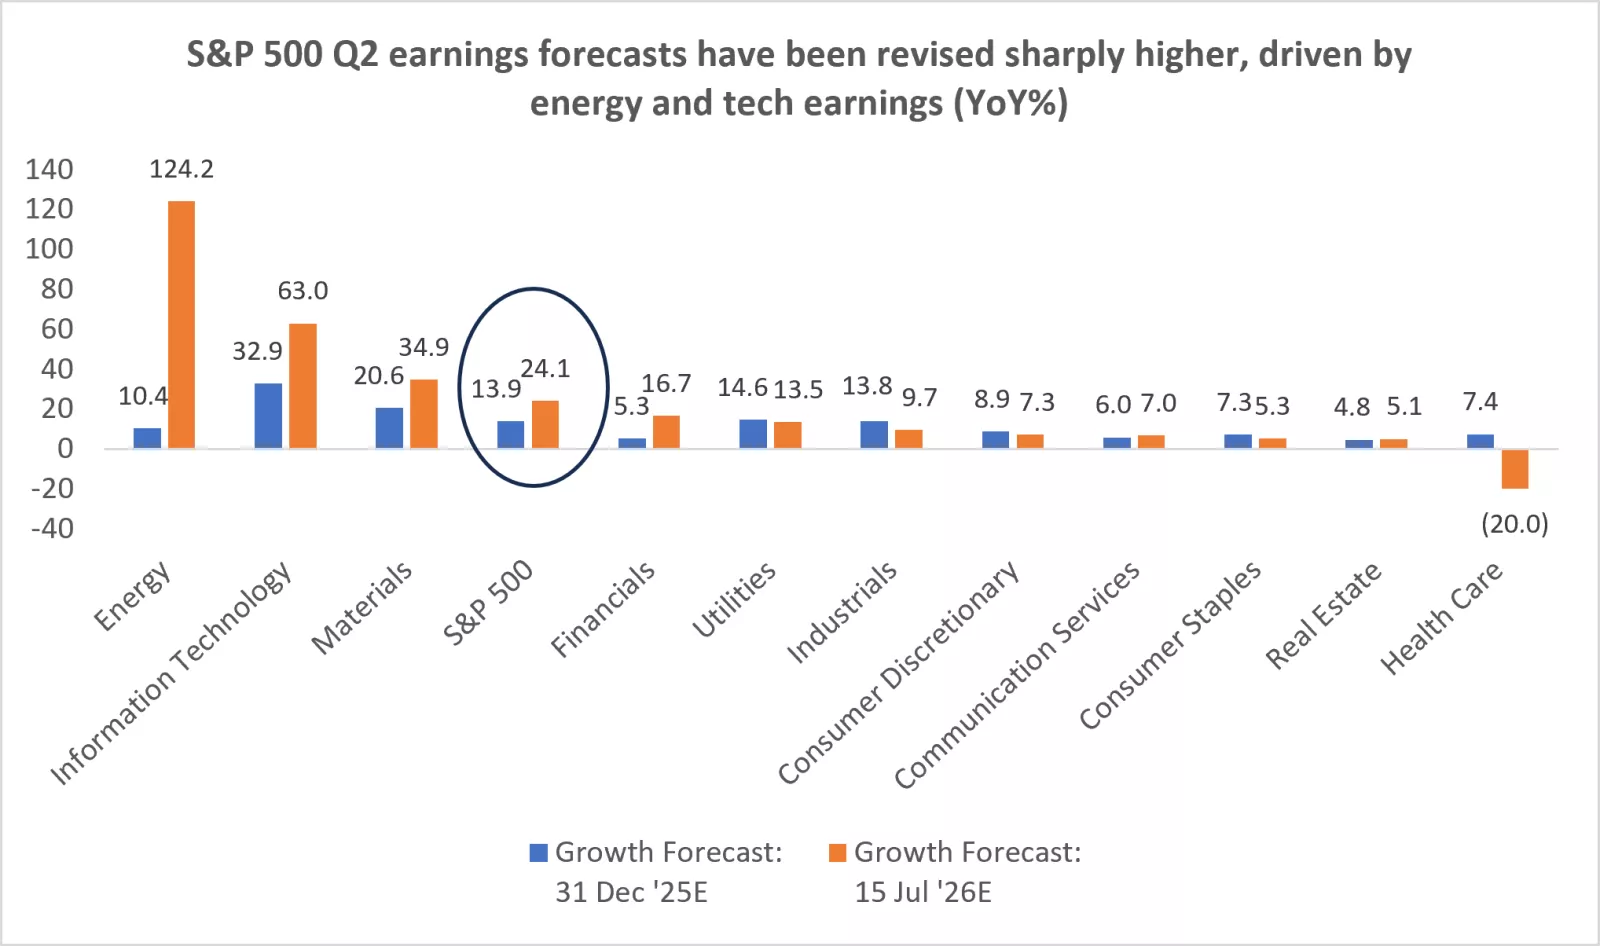
The chart shows that S&P 500 second quarter earnings forecasts have been revised higher, driven by energy and tech earnings.
The chart shows that S&P 500 second quarter earnings forecasts have been revised higher, driven by energy and tech earnings.
As companies continue to report earnings this quarter, investors will be watching for clues on whether earnings growth is sustainable, especially in the technology sector. In particular, there are three questions worth monitoring in the upcoming earnings season:
- What is the growth of AI capex spending going forward? This year, AI capex spending is expected to grow a stellar 75% to between $700 and $800 billion. However, in the next year or two, the pace of this growth will likely slow, with forecasts calling for 25% growth in 2027 and 6% in 2028. If we hear companies reaffirm this guidance, or even exceed it, tech stocks and the semiconductor sector in particular may respond positively.
- Are technology companies seeing sufficient revenue gains from the AI capex spend? Investors will also be watching to see if the companies that are spending on capex, hyper-scalers like Meta and Alphabet, report stronger revenues or point to returns on these investments. If they can justify the spending with better returns, investors will likely reward them accordingly.
- What is the state of the consumer? Finally, investors will be watching to see if the U.S. consumer remains healthy. Thus far, the large banks have reported, including J.P. Morgan, Citi, and Goldman Sachs, and all have pointed to resilient loan growth, credit quality and spending. Consumption is a key driver of economic growth, and more signs of a solid consumer will be welcome for investors.
Bottom line: Q2 earnings season is setting up to be a meaningful one. In the technology sector, investors are looking for trends on AI capex spending and return on this investment. More broadly, the bar for earnings growth is set relatively high, but if companies can deliver – and reaffirm a solid outlook – this may be supportive of the ongoing earnings-driven market rally we've seen this year.
The Fed is on deck for late July
The final piece of the puzzle may lie with the Federal Reserve and what direction it takes interest rates this year. At the June meeting, the Fed kept rates on hold at 3.5%-3.75%, but the FOMC remained divided on the path of interest rates for the rest of the year. Half the members felt keeping rates on hold (or lowering them) was appropriate, while half felt rate hikes were appropriate.
In our view, rate cuts are likely off the table this year, but rate hikes are not a forgone conclusion. This past week, inflation figures were promising: Both CPI and PPI inflation surprised to the downside for headline and core inflation. Since then, however, we have seen oil prices move back higher, and uncertainty around the Iran War remains an overhang. Meanwhile, the U.S. labor market remains steady, although job growth has been uneven across sectors.
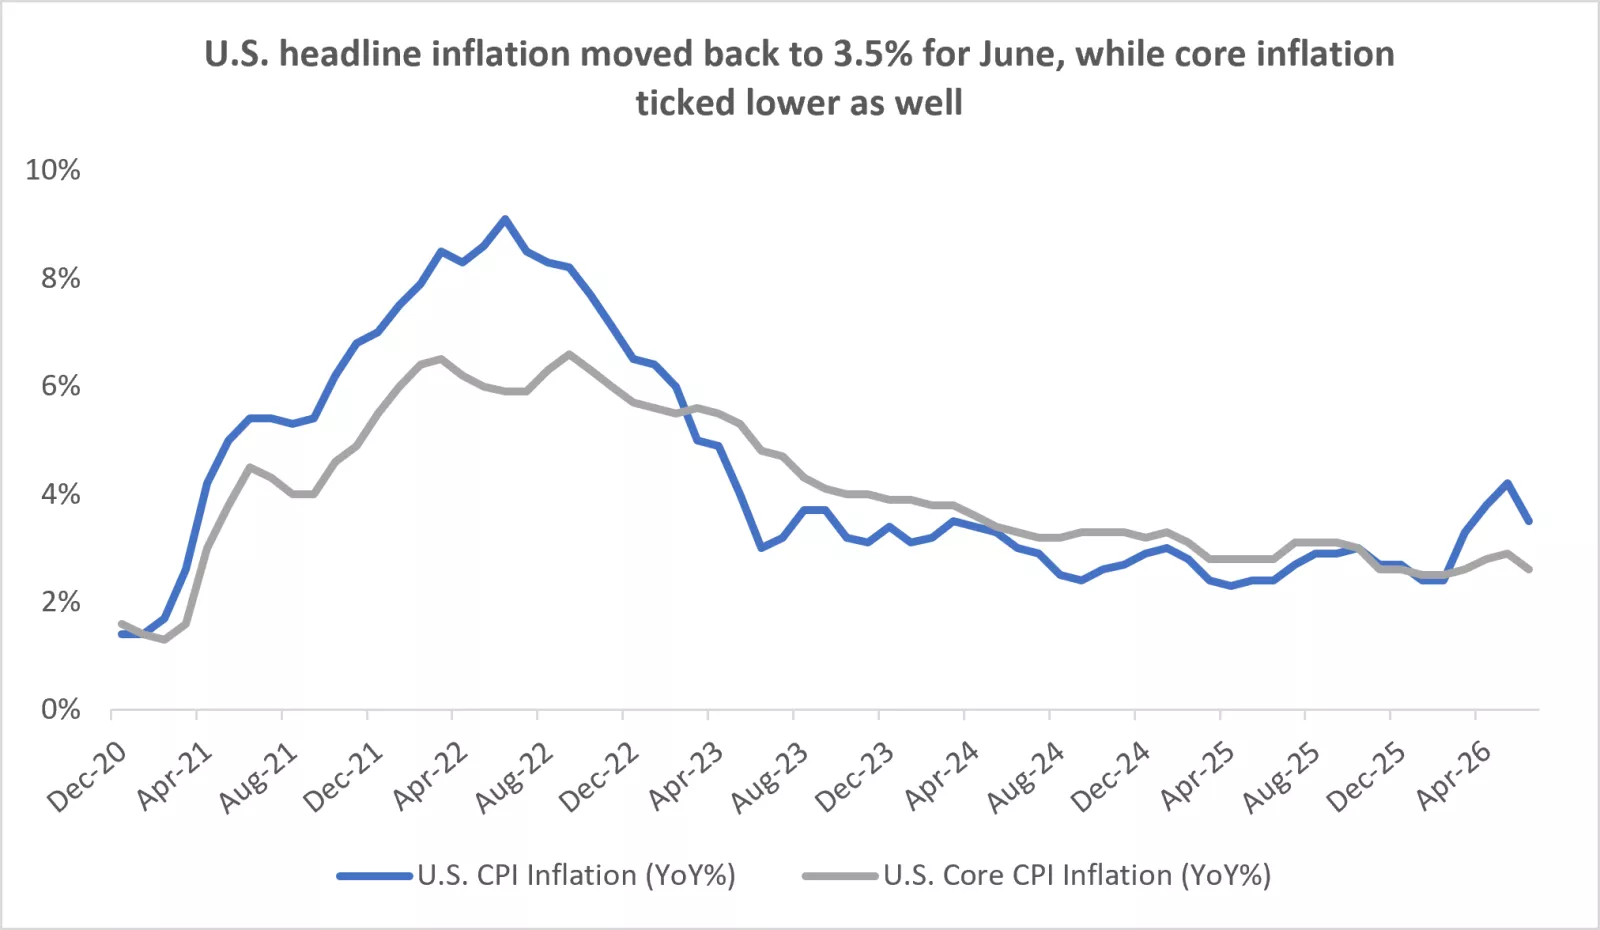
The chart shows that CPI moved lower in June.
The chart shows that CPI moved lower in June.
Bottom line: We believe that the Fed is likely to keep interest rates on hold for the rest of 2026. At the July 29 meeting, we will likely hear more from the FOMC on what data it is monitoring to determine the path going forward. Nonetheless, with inflation still contained and the labor market stable, the bar for rate hikes remains high in our view. The economy and consumer demand have held up well with interest rates at these levels, and we would expect this to continue if interest rates remain steady.
Remain diversified, remain invested
Overall, equity markets have had a solid year despite geopolitical uncertainty and rotation in the tech and AI sectors. The S&P 500 is up about 10% for the year, and this comes after three years of double-digit gains.
While we could continue to see rotation underneath the surface, the good news is that investor appetite for stocks remains robust. This is likely because earnings growth and economic growth continues to deliver. We will be monitoring key trends and takeaways in this quarter's earnings reports as well.
As we look toward the second half of 2026, we recommend investors review their portfolios to ensure they are adequately diversified, in line with their risk and return preferences, and across tech and non-tech parts of the market. We recommend overweight positions in U.S. large cap and mid-cap stocks, as well as emerging market equities. Within U.S. investment grade portfolios, we see short-term bonds offering a better yield advantage versus cash yields. Read our full quarterly outlook and guidance here: https://www.edwardjones.com/us-en/market-news-insights/stock-market-news/quarterly-market-outlook
Mona Mahajan
Investment Strategist
Source for all data in commentary: Bloomberg, FactSet
Mona Mahajan
Mona Mahajan is responsible for developing and communicating the firm's macroeconomic and financial market views. Her background includes equity and fixed income analysis, global investment strategy and portfolio management.
She regularly appears on CNBC and Bloomberg TV, and in The Wall Street Journal and Barron’s.
Mona has a master’s in business administration from Harvard Business School and bachelor's degrees in finance and computer science from the Wharton School and the School of Engineering at the University of Pennsylvania.
Previous weeks' weekly market wraps


Important Information:
The Weekly Market Update is published every Friday, after market close.
This is for informational purposes only and should not be interpreted as specific investment advice. Investors should make investment decisions based on their unique investment objectives and financial situation. While the information is believed to be accurate, it is not guaranteed and is subject to change without notice.
Investors should understand the risks involved in owning investments, including interest rate risk, credit risk and market risk. The value of investments fluctuates and investors can lose some or all of their principal.
Past performance does not guarantee future results.
Market indexes are unmanaged and cannot be invested into directly and are not meant to depict an actual investment.
Diversification does not guarantee a profit or protect against loss in declining markets.
Systematic investing does not guarantee a profit or protect against loss. Investors should consider their willingness to keep investing when share prices are declining.
Dividends may be increased, decreased or eliminated at any time without notice.
Special risks are inherent in international investing, including those related to currency fluctuations and foreign political and economic events.
Before investing in bonds, you should understand the risks involved, including credit risk and market risk. Bond investments are also subject to interest rate risk such that when interest rates rise, the prices of bonds can decrease, and the investor can lose principal value if the investment is sold prior to maturity.