Looking back on the first half
Oil prices fell in the second quarter as geopolitical tensions eased. Alongside resilient economic data and strong corporate earnings growth, this backdrop helped fuel a rally in global stocks, reversing first-quarter weakness and driving solid gains through the first half of the year.
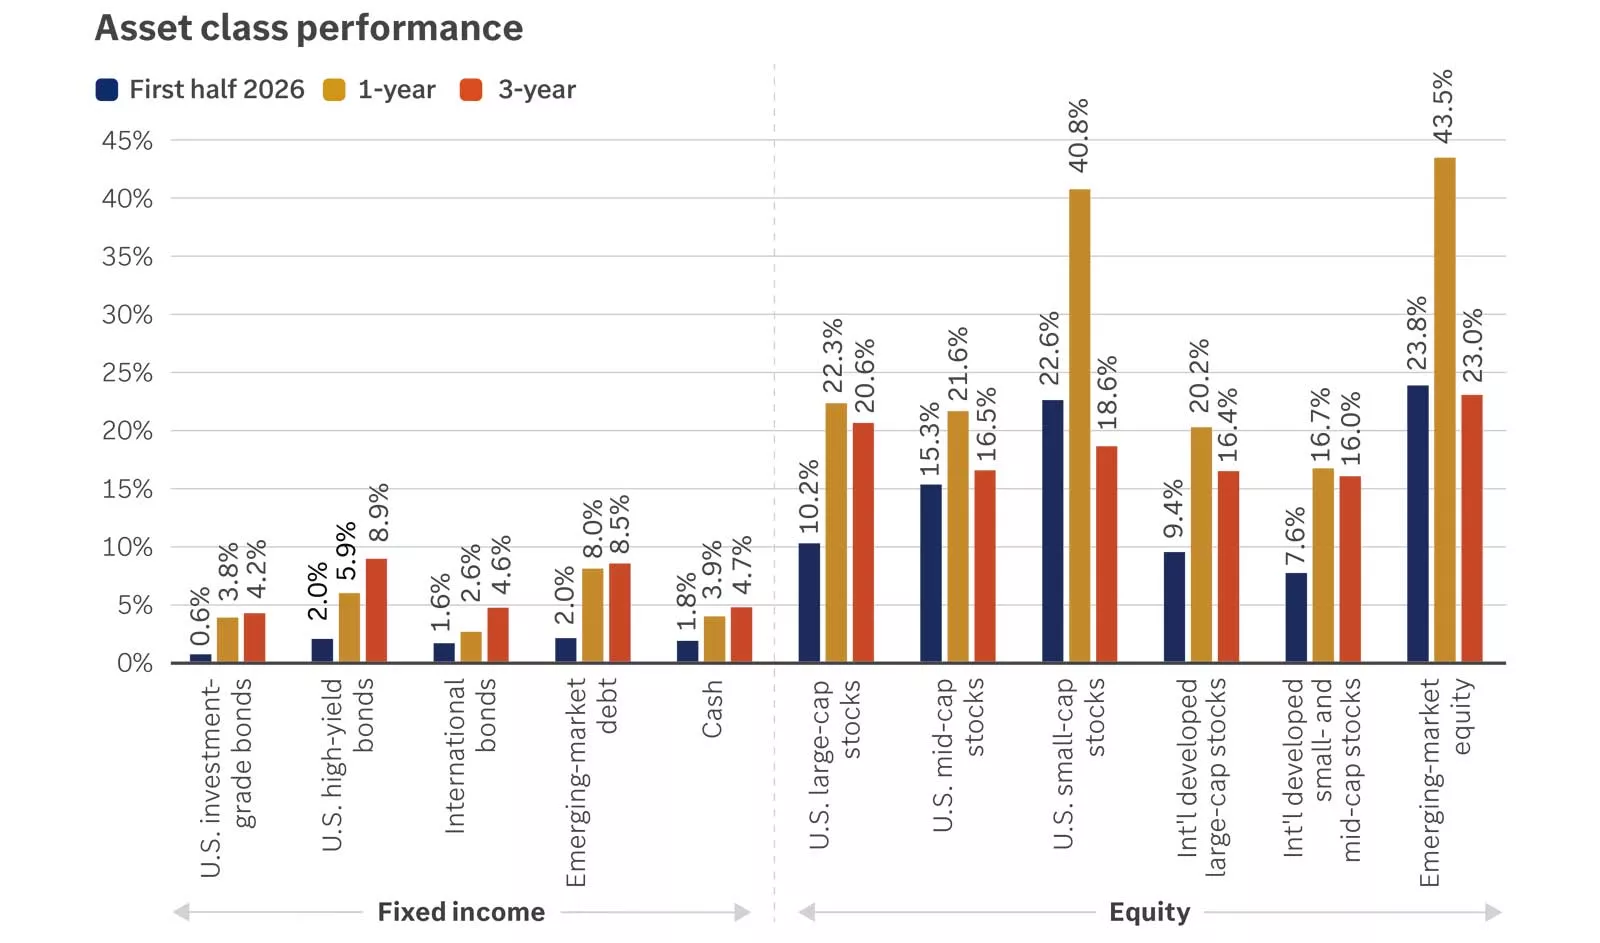
The chart shows the performance of equity and fixed-income asset classes across various time horizons: H1 2026: U.S. Investment-grade bonds: 0.6%, U.S. high-yield bonds: 2%, International bonds: 1.6%, Emerging-market debt: 2%, Cash: 1.8%, U.S. large-cap stocks: 10.2%, U.S. mid-cap stocks: 15.3%, U.S. small-cap stocks: 22.6%, International developed large-cap stocks: 9.4%, International developed small- and mid-cap stocks: 7.6%, Emerging-market equity 23.8%. 1-year: U.S. Investment-grade bonds: 3.8%, U.S. high-yield bonds: 5.9%, International bonds: 2.6%, Emerging-market debt: 8%, Cash: 3.9%, U.S. large-cap stocks: 22.3%, U.S. mid-cap stocks: 21.6%, U.S. small-cap stocks: 40.8%, International developed large-cap stocks: 20.2%, International developed small- and mid-cap stocks: 16.7%, Emerging-market equity: 43.5% 3-year: U.S. Investment-grade bonds: 4.2%, U.S. high-yield bonds: 8.9%, International bonds: 4.6%, Emerging-market debt: 8.5%, Cash: 4.7%, U.S. large-cap stocks: 20.6%, U.S. mid-cap stocks: 16.5%, U.S. small-cap stocks: 18.6%, International developed large-cap stocks: 16.4%, International developed small- and mid-cap stocks: 16%, Emerging-market equity: 23%
The chart shows the performance of equity and fixed-income asset classes across various time horizons: H1 2026: U.S. Investment-grade bonds: 0.6%, U.S. high-yield bonds: 2%, International bonds: 1.6%, Emerging-market debt: 2%, Cash: 1.8%, U.S. large-cap stocks: 10.2%, U.S. mid-cap stocks: 15.3%, U.S. small-cap stocks: 22.6%, International developed large-cap stocks: 9.4%, International developed small- and mid-cap stocks: 7.6%, Emerging-market equity 23.8%. 1-year: U.S. Investment-grade bonds: 3.8%, U.S. high-yield bonds: 5.9%, International bonds: 2.6%, Emerging-market debt: 8%, Cash: 3.9%, U.S. large-cap stocks: 22.3%, U.S. mid-cap stocks: 21.6%, U.S. small-cap stocks: 40.8%, International developed large-cap stocks: 20.2%, International developed small- and mid-cap stocks: 16.7%, Emerging-market equity: 43.5% 3-year: U.S. Investment-grade bonds: 4.2%, U.S. high-yield bonds: 8.9%, International bonds: 4.6%, Emerging-market debt: 8.5%, Cash: 4.7%, U.S. large-cap stocks: 20.6%, U.S. mid-cap stocks: 16.5%, U.S. small-cap stocks: 18.6%, International developed large-cap stocks: 16.4%, International developed small- and mid-cap stocks: 16%, Emerging-market equity: 23%
Tale of two quarters
Equity markets began the year on the back foot, with U.S. large-cap stocks falling 4.3% in the first quarter amid rising oil prices tied to the war in Iran. However, deescalating geopolitical tensions, resilient economic data and a solid first-quarter earnings season helped turn sentiment around. U.S. large-cap stocks gained 15.2% in the second quarter, bringing first-half gains to 10.2%.
Economically sensitive U.S. small-cap stocks led the way, rising 21.5% in the second quarter and 22.6% year-to-date. U.S. mid-cap stocks also posted solid returns, advancing 13.8% in the second quarter and 15.3% year-to-date.
Overseas markets also moved higher. International developed-market equities posted broad first-half gains, while emerging-market stocks rallied 23.8%. Emerging-market returns were supported by strength in technology-heavy markets such as Taiwan and Korea, where indexes have benefited from strong performance in semiconductor stocks tied to the AI buildout.
Value takes the lead
Value-style stocks outperformed in the first half, with the Russell 1000 Value Index gaining 16.3% compared with a 5.3% gain for growth-style stocks. While AI-related spending has continued to support strong earnings increases in growth-oriented segments of the market, earnings momentum has broadened to value. The Russell 1000 Value Index posted first-quarter earnings growth of more than 15%, its first quarter above 10% since the fourth quarter of 2024. Full-year earnings growth is expected to exceed 20%, supporting value’s first-half outperformance.
The trend was also evident overseas, though less pronounced. Developed international value-style stocks outpaced developed international growth stocks in the first half of 2026, extending their recent relative strength. Over the past year, international value has outperformed international growth by more than 13%, supported by stable global economic activity.
Bonds hold steady as central bank rate expectations reset
Bonds underperformed equity markets but still posted positive returns in the first half. Global government bond yields trended modestly higher, as an energy-driven spike in headline inflation led investors to reassess central bank policy expectations. The European Central Bank and Bank of Japan raised rates, while markets now expect one Federal Reserve rate hike before year-end. This policy reset kept a lid on fixed-income returns, with each of our recommended fixed-income asset classes returning between 0.6% and 2% in the first half.
Action for investors
The sharp second-quarter rebound highlights the importance of maintaining a disciplined investment approach through periods of uncertainty. Investors can use this time to revisit strategic allocations and ensure their portfolios remain aligned with their long-term goals.
Economic outlook
Concerns about the health of the U.S. economy have faded as the labor market builds momentum and consumers remain resilient, even through a spike in energy prices. Inflation dynamics look more troubling, but price growth should cool through the summer, absent any renewed tensions in the Middle East.
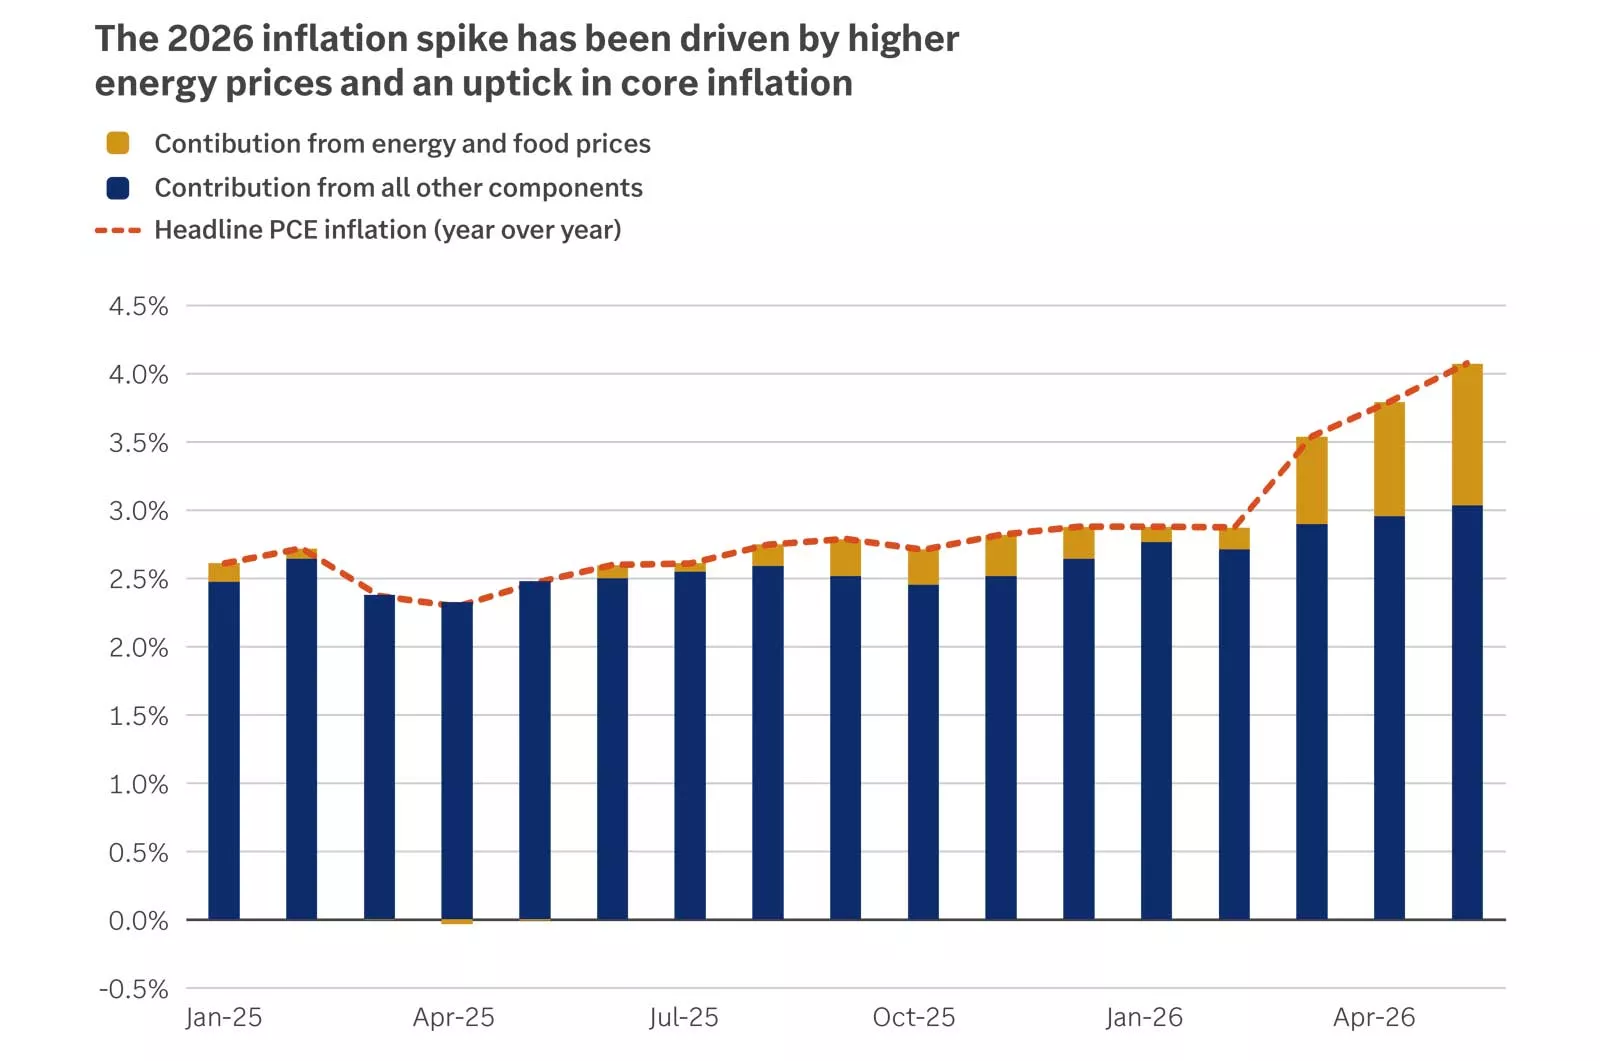
The chart shows that the rise in inflation this year has been driven by a combination of higher energy prices and an uptick in core inflation.
The chart shows that the rise in inflation this year has been driven by a combination of higher energy prices and an uptick in core inflation.
U.S. growth rumbles on
The economy has been remarkably resilient in the face of shocks in recent years, and this resilience was on full display this spring as energy prices surged. Households did not let spiking gas prices derail their spending, with a boost from this year’s tax refunds helping underpin consumption.
Meanwhile, business sentiment dipped on the outbreak of conflict in Iran, but there were few signs of firms becoming more defensive. Instead, hiring has accelerated in recent months, and capex trends remain robust. Looking ahead, a combination of solid household consumption and strong business investment, particularly related to AI spending, should keep economic growth at trend-like rates of about 2% this year.
Inflation more troubling
Headline inflation hit a three-year high in May, driven by surging gas and energy prices. The good news is that the recent collapse in oil prices will help partially reverse this spike, bringing headline price growth lower through the summer. However, even excluding these energy price swings, inflation looks too high right now. The latest core personal consumption expenditures (PCE) inflation reading, which excludes food and energy prices, showed price growth at 3.4%, well above the Fed’s 2% target. This measure should also moderate gradually in coming months, helped by a fading inflation impulse from tariffs, moderate wage pressures and softening rental inflation. But the risk of stickier inflation has increased, and the Fed will be alert to signs of broadening price pressures. Indeed, about half of the Fed’s interest rate-setting committee expects to raise rates this year, highlighting the low bar to tightening should we see further inflation disappointments.
Middle East risks lower but not forgotten
The interim peace agreement between the U.S. and Iran has helped reopen the Strait of Hormuz, and we are already seeing energy supply rebound as tanker traffic increases. However, this 60-day agreement leaves several contentious issues to resolve before a more permanent deal is signed. These include the future of Iran’s nuclear program, control of the Strait of Hormuz and fighting in Lebanon. In our base case, we expect these issues to be either overcome or rolled into extended negotiations, reflecting a political will for both sides to find a diplomatic solution to this conflict. However, the risk that these sticking points prompt renewed tensions has certainly not gone away.
Action for investors
A sharp decline in oil prices during June should provide another tailwind for the economy alongside tax cuts and an improving labor market. These solid fundamentals bode well for the broadening in corporate earnings growth we have seen this year, and we continue to prefer to hold overweight positions in equities.
Equity outlook
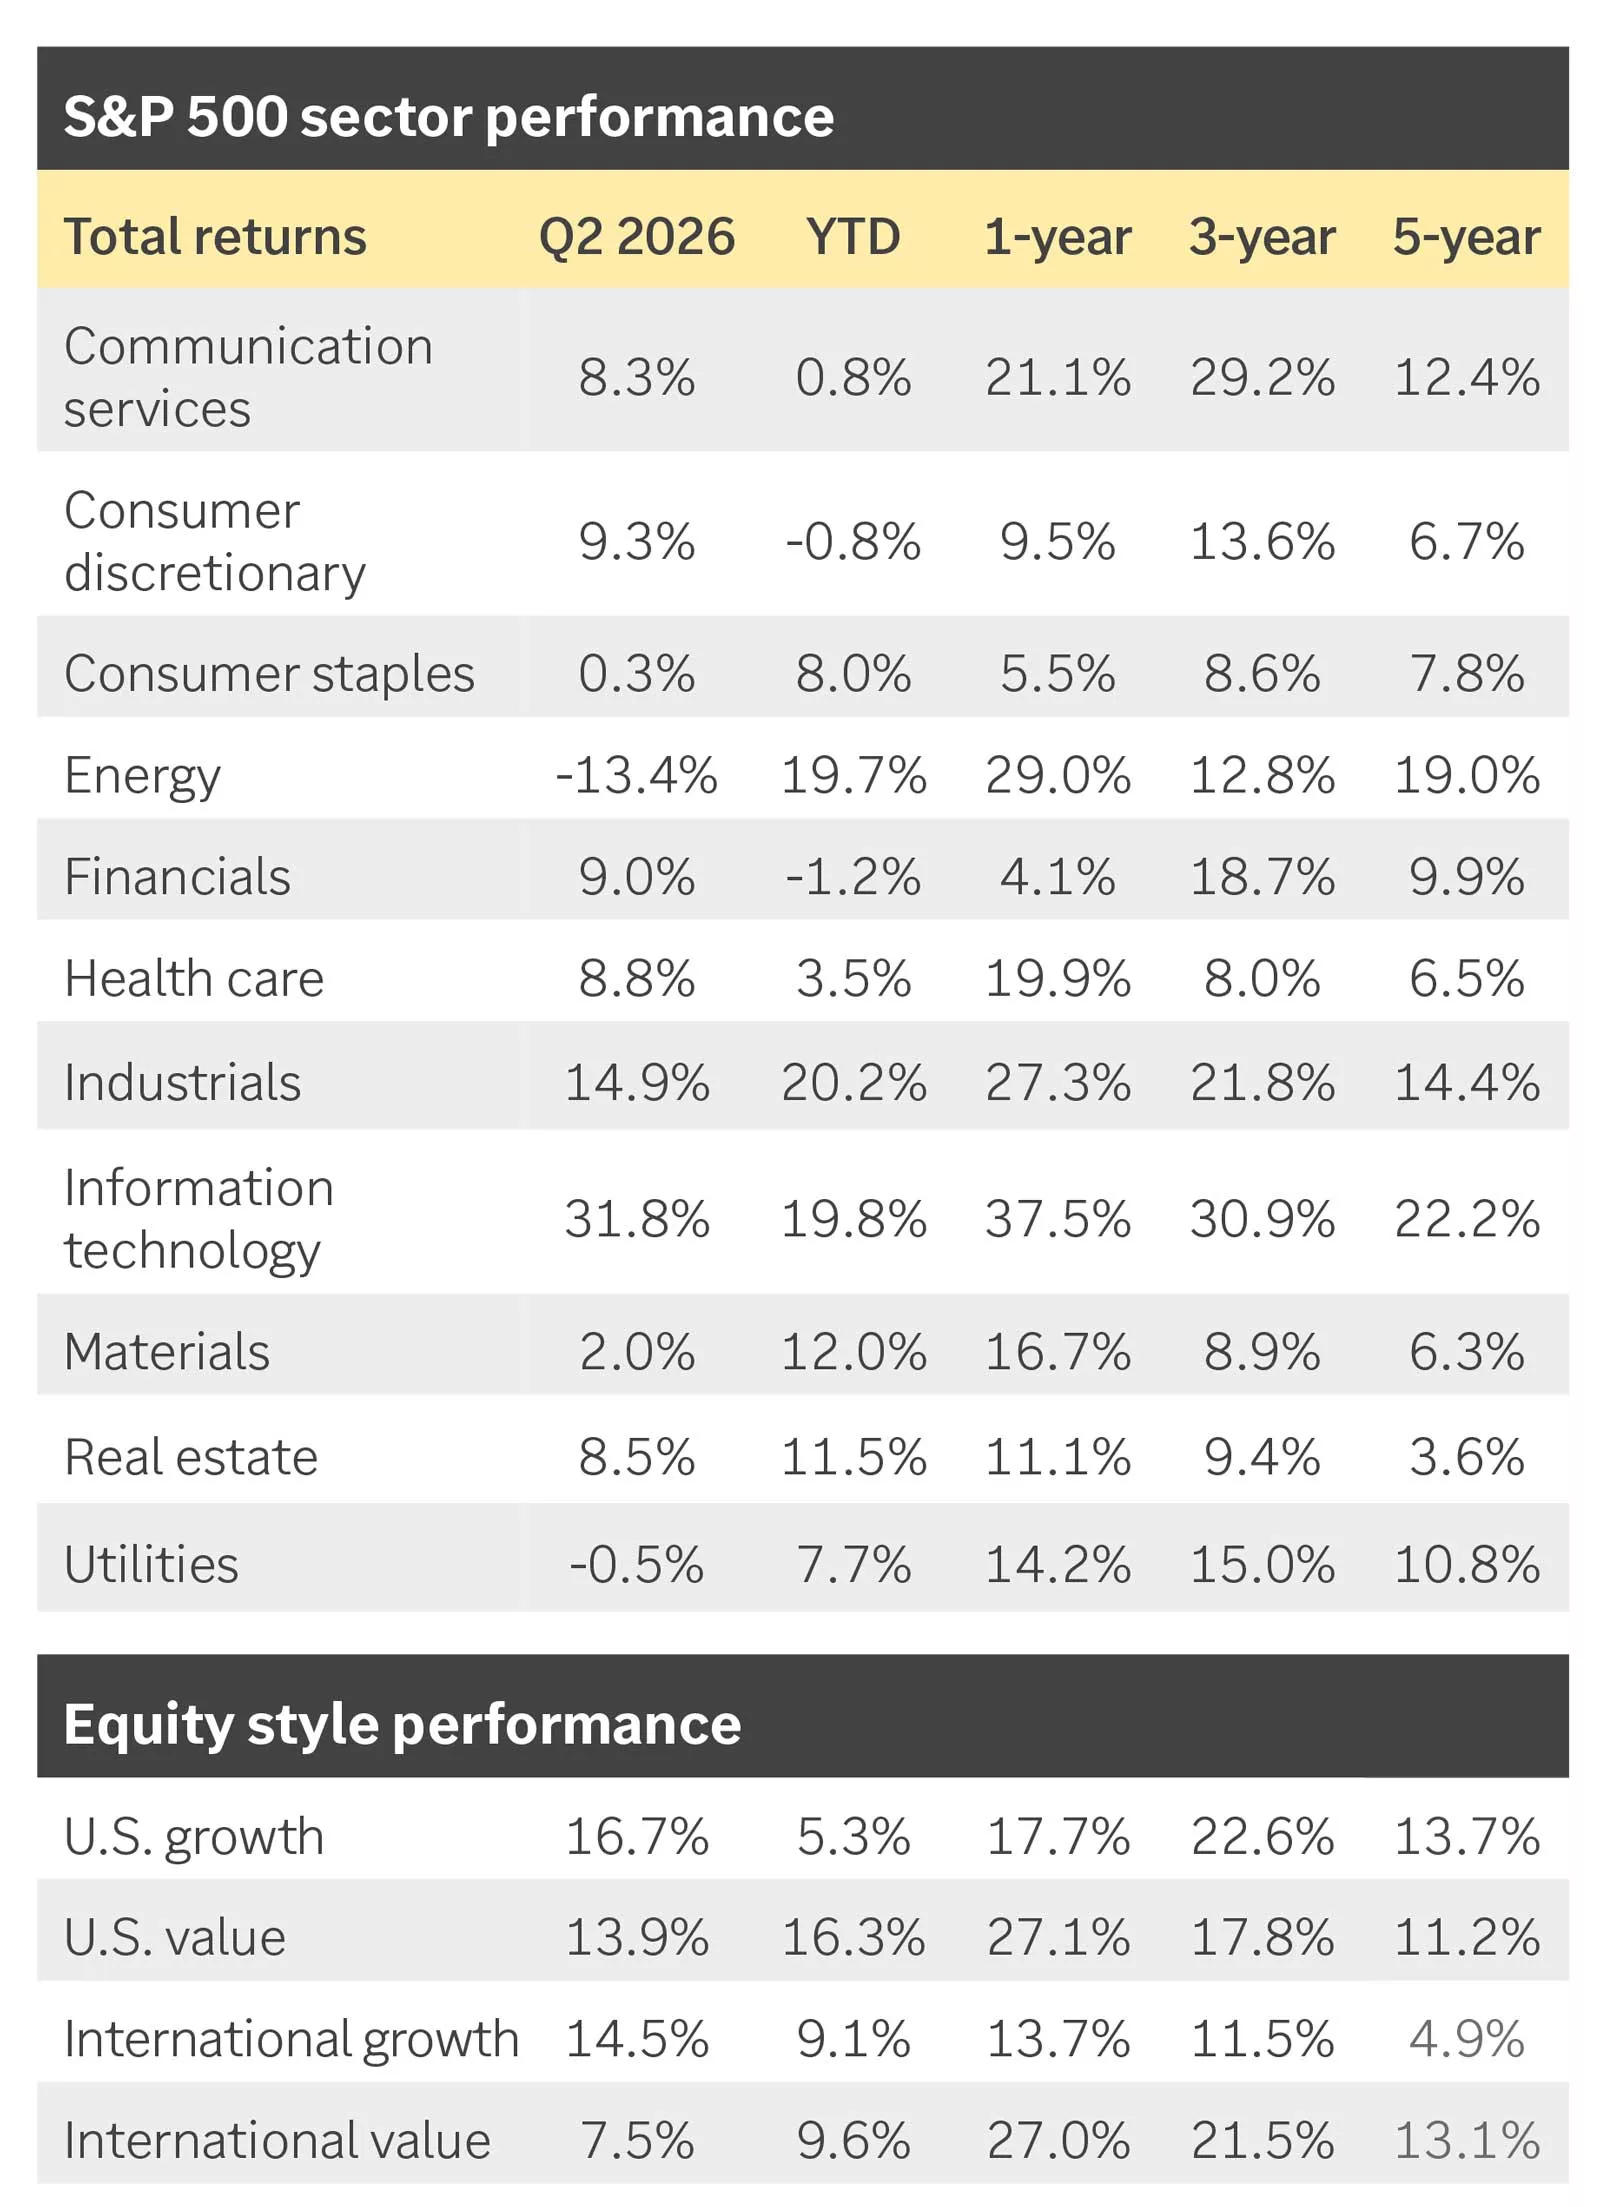
While technology and AI-driven stocks led Q2 performance, there was a rotation away from tech in recent weeks.
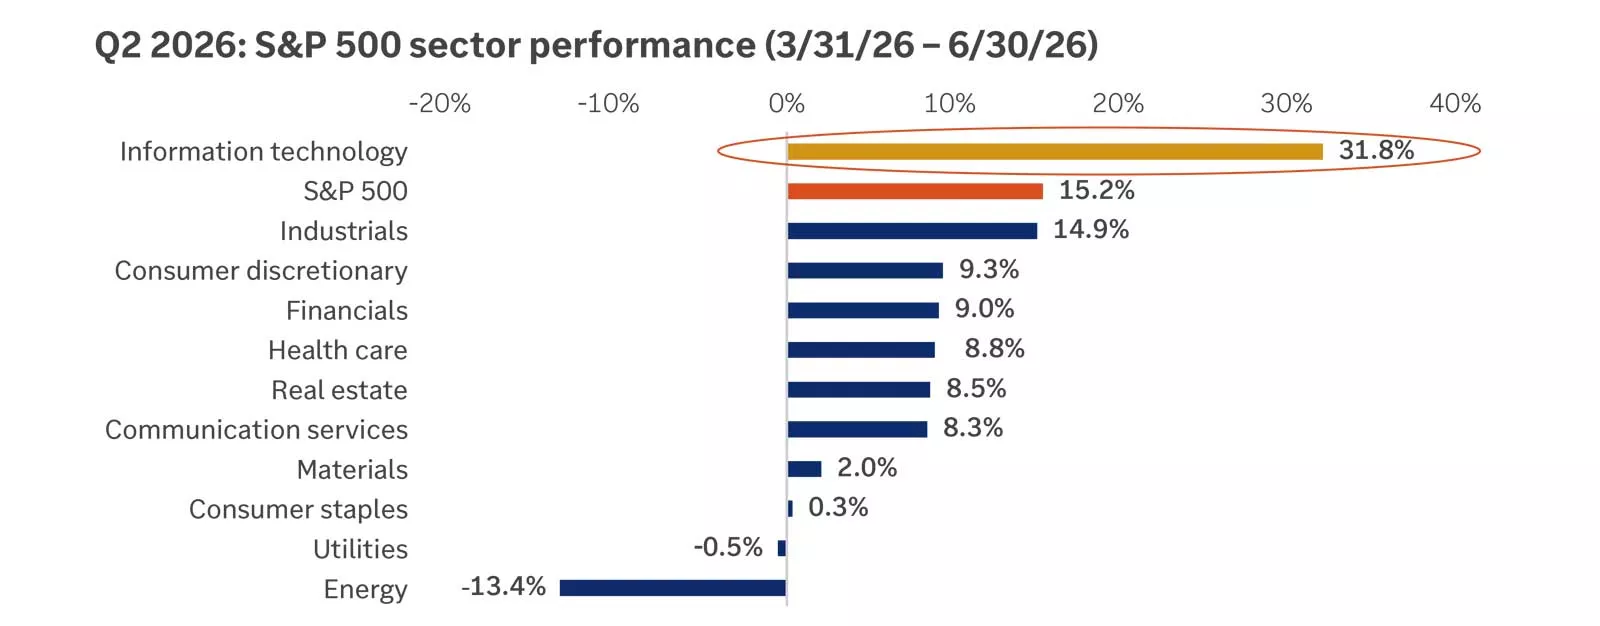
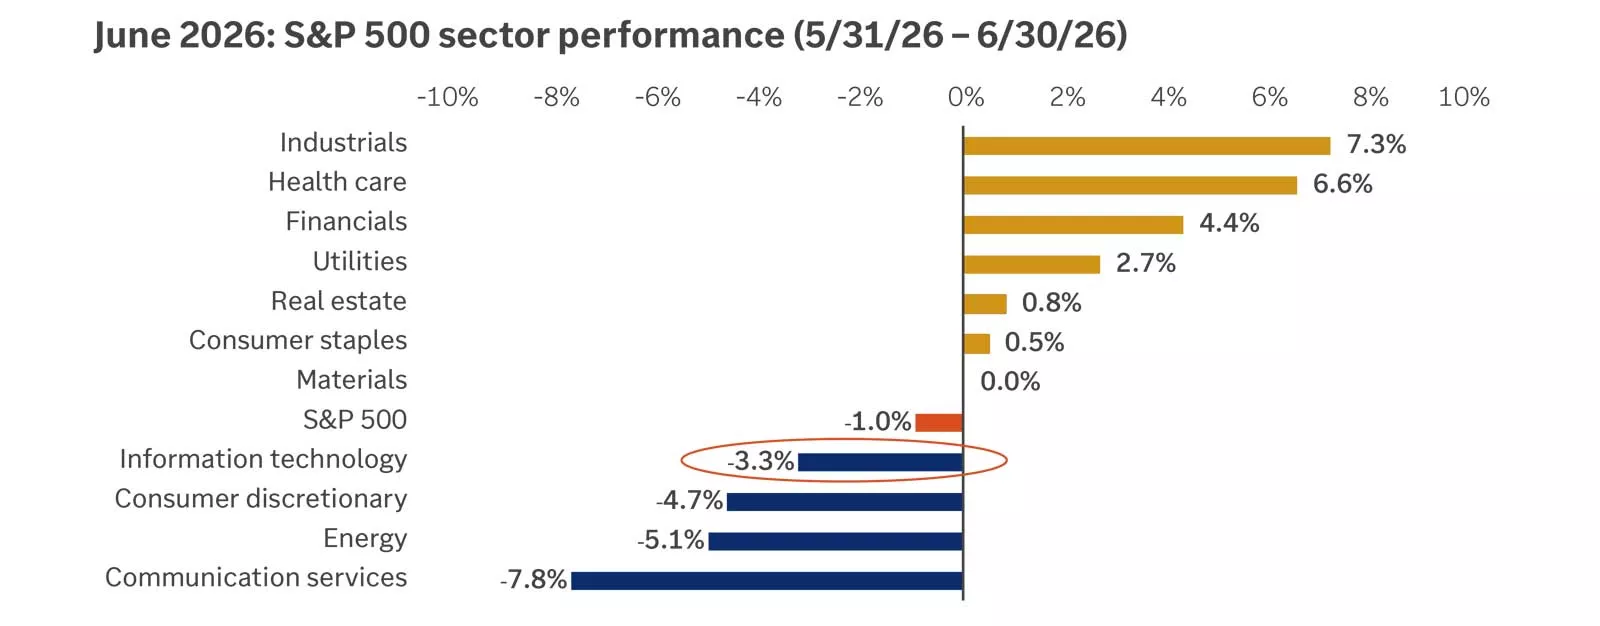
The chart shows that the information technology sector outperformed in the second quarter, gaining 31.8%. However, in the final month, it lagged the S&P 500, falling 3.3%, while industrials, health care and financials outperformed.
The chart shows that the information technology sector outperformed in the second quarter, gaining 31.8%. However, in the final month, it lagged the S&P 500, falling 3.3%, while industrials, health care and financials outperformed.
Does the recent market rotation have legs?
During the second quarter, the S&P 500 rebounded from its March lows and was up more than 15%. The move was driven by an impressive 31.8% rise in the technology sector, largely among semiconductor stocks.
However, in the last few weeks of the quarter, we saw a notable reversal in market leadership: The technology sector fell about 3%, while sectors such as industrials, health care and financials led the way higher. (See the chart.)
Investors may be wondering whether this rotation away from tech and into more cyclical sectors can continue. In our view, the broadening of market leadership could have legs for a couple reasons.
First, we are seeing early signs that oil prices are moving lower, driven by optimism around a potentially lasting peace deal in Iran and more oil flowing through the Strait of Hormuz. This would be positive for consumers as well as corporations reliant on energy inputs.
Second, we continue to see stabilization and positive trends in the U.S. labor market. Job growth has surprised to the upside over the quarter, and the unemployment rate has remained steady at about 4.3%. This has also supported consumer demand and solid economic growth, which we believe is also positive for cyclical sector performance.
Corporate earnings growth remains solid
Nonetheless, while we see the scope for the broadening of market leadership to continue, we would not give up on technology sectors altogether. The primary reason is that corporate earnings growth this year is expected to be driven largely by tech and AI-related sectors.
In fact, for the third quarter, forecasts for S&P 500 earnings growth have risen from about 15% at the start of the year to about 27% now. This upward revision has largely been driven by technology sector earnings, which were expected to grow by about 27% at the start of 2026 and are now forecast to grow by 57%. The growth in tech earnings is coming from areas such as AI capex spending and rising semiconductor demand.
We are also seeing substantial upward revisions in energy and materials earnings growth, as oil prices have moved higher, but these sectors do not have as much weighting in the S&P 500. The technology sector makes up about 37% of the S&P 500 as of the end of Q2, versus energy and materials, which account for only about 5% combined.
Overall, we know stock markets are underpinned by earnings growth, and the S&P 500 earnings growth for the quarter and for the full year look quite strong, in both tech and non-tech parts of the market.
Action for investors
We believe market broadening will continue and investors should have exposure to tech and cyclical parts of the market. We recommend remaining overweight in U.S. large-cap stocks, which have tech and AI exposure, and U.S. mid-cap stocks, which could benefit from an ongoing broadening of leadership. From a sector perspective, we favor industrials and communication services, which provide exposure to cyclical and tech parts of the market.
Fixed-income outlook
With inflation moving further above the Fed’s 2% target, we no longer expect rate cuts this year. Bond yields are therefore likely to remain elevated, with the 10-year Treasury staying near the upper end of our expected 4.0%–4.5% range for this year.
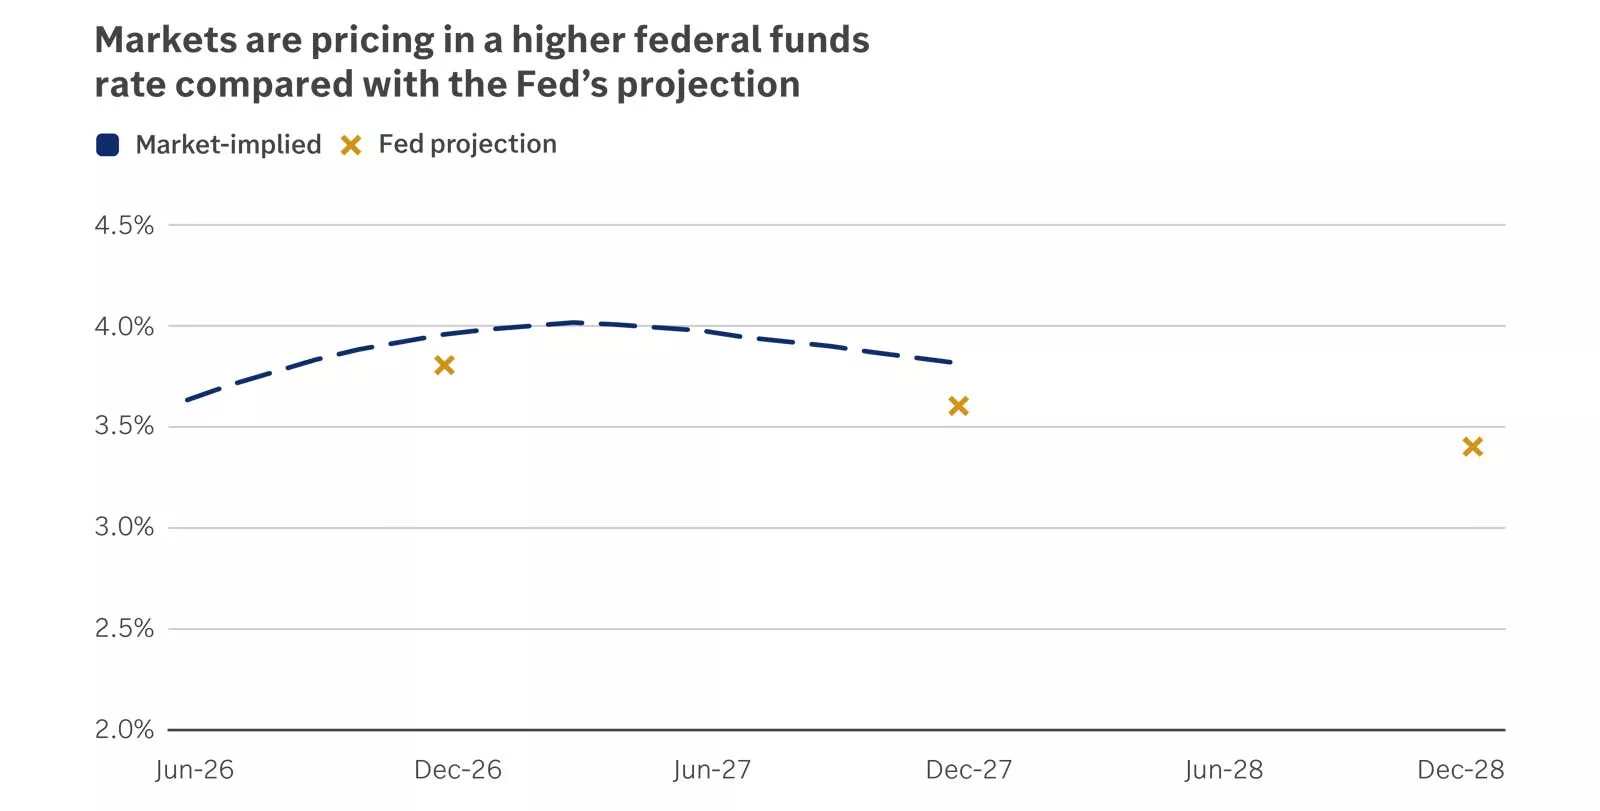
The chart shows that markets are pricing in a higher federal funds rate in 2026 and 2027 compared to what Fed members projected in the June Summary of Economic Projections.
The chart shows that markets are pricing in a higher federal funds rate in 2026 and 2027 compared to what Fed members projected in the June Summary of Economic Projections.
Fed appears set to stay on hold
The Fed’s June economic projections signaled a modestly more hawkish stance, removing the previously forecast 2026 rate cut from the dot plot. However, officials remain divided on the path forward. Half of participants project at least one rate hike, while the rest expect no change or a cut. This suggests there is not yet a clear consensus for tightening, but the debate has shifted from when to cut to whether current policy can return inflation to target within a reasonable time frame.
The Fed’s preferred inflation gauge has risen in recent months, partly reflecting higher energy prices. The headline figure moved above 4% in May, while core inflation increased more moderately. Goods prices have firmed, but services inflation has not shown broad-based reacceleration. Still, both the headline and core measures have moved notably above target, leaving the Fed with little room to ease policy.
Policymakers still expect headline inflation to return to target by 2028, indicating they believe the recent pickup is unlikely to become persistent. If inflation pressures remain concentrated mostly in energy, the Fed may be reluctant to respond aggressively to what could prove to be a temporary supply shock. But if energy costs feed into broader goods and services prices — or if long-term inflation expectations drift higher — policymakers may be more inclined to consider a hike. The inflation outlook could become more balanced if geopolitical risks continue to ease and oil prices remain lower.
The resilient labor market also gives policymakers more room to prioritize inflation risks. The unemployment rate remains at 4.2%, in line with the Fed’s long-run projection, which is widely viewed as its estimate of full employment. With the employment side of the Fed’s dual mandate largely being met, policymakers have less urgency to ease policy.
While markets reflect some likelihood of a rate hike, shown in the chart, we believe a prolonged pause is the most likely outcome. The Fed is unlikely to ease while inflation is moving higher, but there is not yet enough consensus to make tightening our base case. Even if the Fed delivers a single rate hike, we believe markets would likely view it as a midcycle adjustment rather than the start of a renewed tightening cycle, provided inflation expectations remain contained.
Bond yields likely to remain rangebound but elevated
With rate cuts likely off the table in the near term, the rate backdrop should remain higher for longer. We expect the 10-year Treasury yield to remain near the upper end of our expected 4.0%–4.5% range. Moderating inflation expectations, helped by easing energy prices, could limit further upward pressure on yields. At the same time, resilient economic growth, a steady labor market and concerns over fiscal deficits should make a sustained decline in yields unlikely.
The result appears likely to be a rangebound but elevated yield environment. Meaningful bond rallies that push yields lower may require clearer evidence that inflation is moving back toward target or that the labor market is cooling enough to revive expectations of rate cuts.
Action for investors
We recommend continuing to overweight equities and underweight select areas of fixed income, including U.S. investment-grade bonds and international bonds. A sustained move above 4.5% in the 10-year Treasury yield could present an opportunity to extend duration with long-term bonds, particularly if inflation expectations remain contained. Credit spreads have tightened well below their historical average but could stay contained, supported by resilient economic growth and strong corporate earnings.
International outlook
International stocks have outpaced U.S. returns since the start of 2025 despite global trade disruptions and a flare-up in geopolitical risks. With trade and energy headwinds now likely easing, we expect global exposures to continue adding value to well-diversified portfolios.
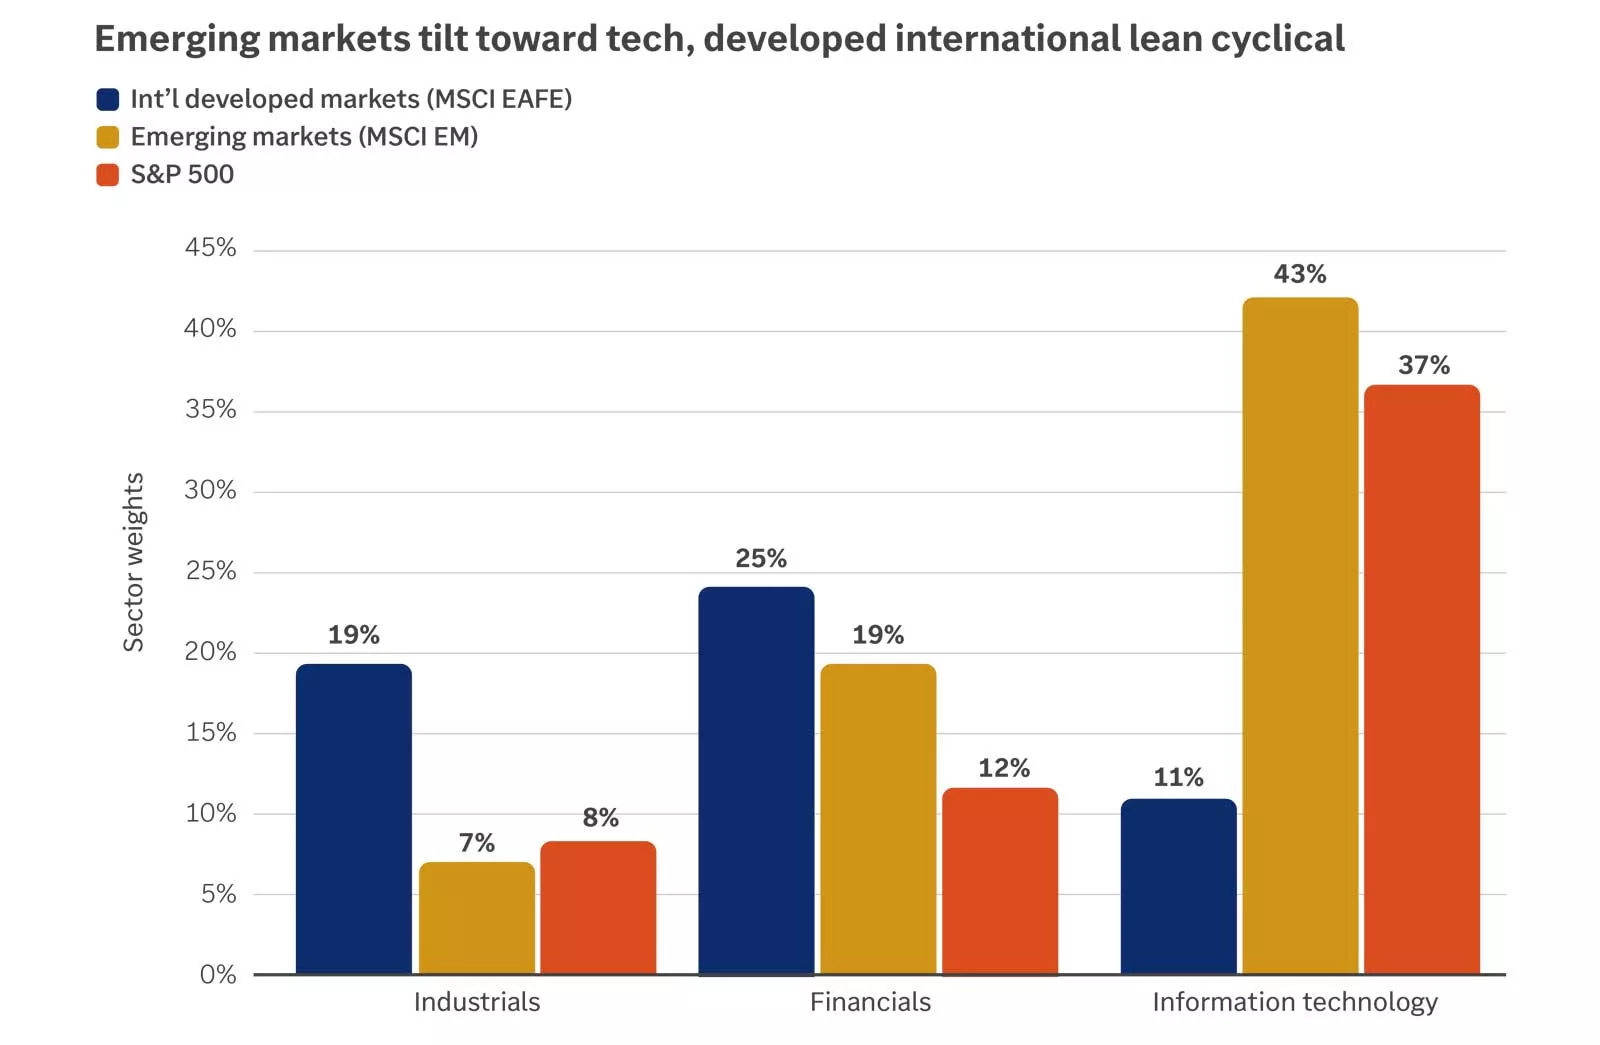
The chart shows that U.S. large-cap stocks and emerging-market stocks are heavily weighted in the technology sector, while international developed stocks tilt more toward cyclical sectors like financials and industrials.
The chart shows that U.S. large-cap stocks and emerging-market stocks are heavily weighted in the technology sector, while international developed stocks tilt more toward cyclical sectors like financials and industrials.
Emerging markets ride the AI wave
Like U.S. equities, emerging-market stocks are primarily driven by trends in technology. In particular, Korea and Taiwan, which have surpassed China’s weight in the broader index, are benefiting from heavy investment in semiconductors and other AI infrastructure. Eight of the top 10 holdings in the MSCI Emerging Markets Index are tech or tech‑adjacent stocks, representing about 40% of the index. This concentration presents a risk, but there are currently no signs that the AI boom is nearing an end. In addition, the nearly 50% expected earnings growth this year provides strong fundamental support.
Developed markets are more sensitive to cyclical forces
Based on their sector mix, developed market equities — including the eurozone, UK and Japan — are more sensitive to manufacturing and global growth cycles. Earlier in the year, their heavier reliance on energy imports from the Middle East created a headwind. However, the recent geopolitical deescalation after the U.S.-Iran agreement and subsequent drop in oil prices is providing relief and helping ease stagflation concerns.
While economic and earnings momentum will likely continue to lag the U.S., we see diversification value in international developed equities, particularly as a hedge against periodic AI‑related disappointments. A budding global manufacturing recovery reflected in survey data such as the global manufacturing Purchasing Managers’ Index should also support cyclical and value sectors, which are well-represented in major indexes.
The dollar is making a comeback, but not a major headwind for international returns
After persistent pressure throughout 2025, the U.S. dollar has strengthened modestly this year, first supported by heightened geopolitical uncertainty and more recently by a hawkish shift from the Federal Reserve. Other major central banks, including those in the eurozone and Japan, have responded to inflation with interest‑rate hikes. However, the probable peak in inflation in the second quarter is likely to reduce the need for further tightening. In the U.S., stronger economic growth and an improving labor market may justify a more cautious policy stance, potentially shifting interest‑rate differentials in favor of the dollar. Even so, we expect the dollar to remain rangebound, as it still appears overvalued relative to other currencies. Importantly, the Fed is unlikely to embark on another major tightening cycle, with interest rates having more room to fall than rise, in our view. While currency moves can boost or detract from international returns, we expect economic and earnings growth, rather than the dollar, to be the primary driver of relative performance for the remainder of the year.
Action for investors
We recommend an overweight to emerging‑market equities to capture AI‑driven growth, offset by an underweight to international developed equities. From a style perspective, we favor international developed value for its diversification benefits and exposure to cyclical sectors that could benefit from a global growth rebound.
The K-shaped economy
The U.S. is increasingly described as a K-shaped economy, in which higher-income households are largely prospering while lower-income households fall behind. How big are these splits, and what do they mean for investors?
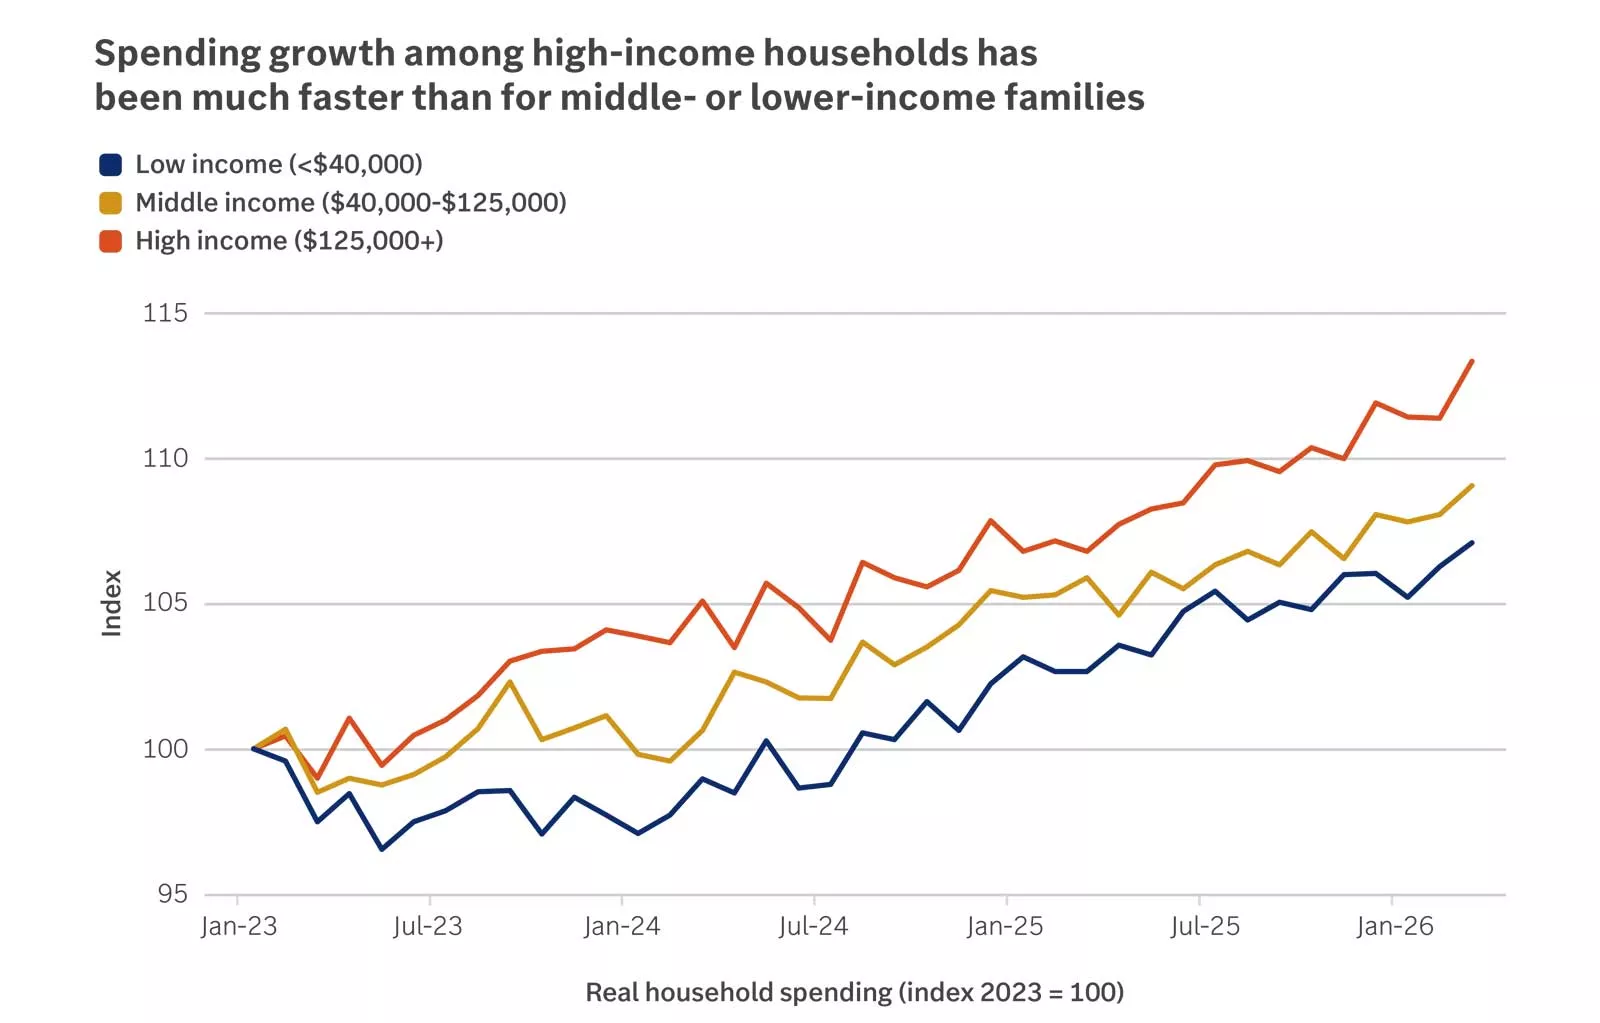
The chart shows that wage growth for high-income households has outpaced that of low- and middle-income households over the past three years.
The chart shows that wage growth for high-income households has outpaced that of low- and middle-income households over the past three years.
Uncovering the K
We can see clear signs of a K-shaped economy in the latest spending data. Since the start of 2023, spending among higher-income households (earning $125,000 or more per year) is up about 13%, nearly double the amount for lower-income households (earning $40,000 or less). Following this run, the top 20% of the income distribution now accounts for almost 40% of consumer spending in the U.S. economy. Other data adds to this sense of diverging fortunes across the income distribution. Consumer confidence for lower-income households is below their high-income peers, and there are signs of financial distress in this cohort, with delinquencies for auto loans and credit cards increasing.
What is driving these splits?
There are likely a few forces combining to drive the K-shaped economy. First, long-running gaps in wage growth mean higher-income households have more money to spend. There was a period after the COVID-19 pandemic when this trend reversed as wages for lower-income workers surged. However, these gains have since moderated, shifting measures of wage inequality higher again. The recent outburst of inflation has exacerbated these gaps, with lower-income households typically spending more on essentials such as groceries, gas and rent, all of which have recently seen large price increases. Finally, higher-income households are more likely to have benefited from the surge in asset prices, including stock market gains, in recent years. By contrast, lower-income households hold fewer assets, potentially missing out on these gains.
Why does this matter?
Aside from equity concerns, there are some key reasons the K-shaped economy is important for the economy and markets. A reliance on a small portion of consumers to drive overall consumer spending could leave the economy vulnerable should sentiment shift among this group. There are few signs of the highest earners losing steam in the latest data, but it is concerning to see consumer spending growth driven by a narrow share of households. Meanwhile, this divergence could mask deepening financial vulnerabilities among lower-income households, which could lead to financial risks for the future. Finally, from an investment standpoint, companies that cater to higher-income consumers might be better placed against the backdrop of this bifurcation, while companies more oriented toward consumer staples and everyday essentials could struggle.
Action for investors
The K-shaped economy is a useful reminder of how differently families and businesses across the U.S. can experience the economy. Our financial advisors can help provide tailored support to help you reach your long-term financial goals regardless of where you may fall in the K-shaped economy.
Strategic asset allocation guidance
Our strategic asset allocation guidance represents our view of balanced diversification for the fixed-income and equity portions of a well-diversified portfolio based on our outlook for the economy and markets over the next 30 years. The exact weightings (neutral weights) to each asset class will depend on the broad allocation to equity and fixed-income investments that most closely aligns with your comfort with risk and financial goals.
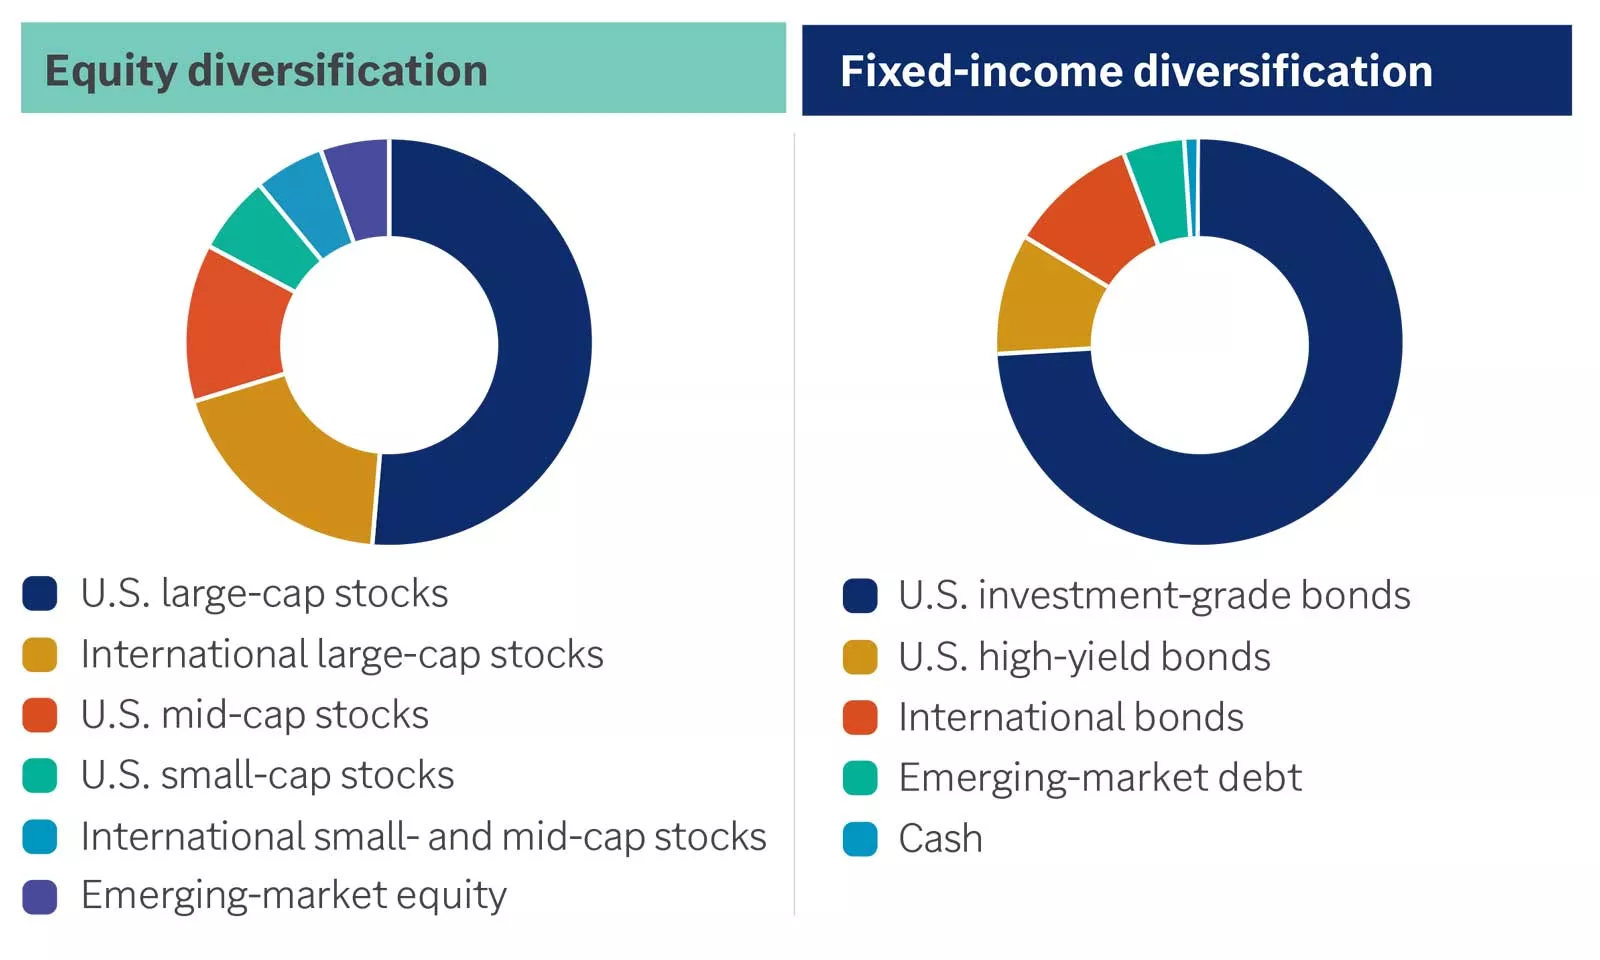
Within our strategic guidance, we recommend these asset classes: Equity diversification: U.S. large-cap stocks, international large-cap stocks, U.S. mid-cap stocks, U.S. small-cap stocks, international small- and mid-cap stocks, emerging-market equity. Fixed-income diversification: U.S. investment-grade bonds, U.S. high-yield bonds, international bonds, emerging-market debt, cash.
Within our strategic guidance, we recommend these asset classes: Equity diversification: U.S. large-cap stocks, international large-cap stocks, U.S. mid-cap stocks, U.S. small-cap stocks, international small- and mid-cap stocks, emerging-market equity. Fixed-income diversification: U.S. investment-grade bonds, U.S. high-yield bonds, international bonds, emerging-market debt, cash.
Opportunistic portfolio guidance
Our opportunistic portfolio guidance represents our timely investment advice based on our global outlook. We expect this guidance to enhance return potential relative to our long-term strategic portfolio guidance while seeking to avoid unintended portfolio risks. We recommend first considering our opportunistic asset allocation guidance to capture opportunities across asset classes. We then recommend considering opportunistic equity style, U.S. equity sector and U.S. investment-grade bond guidance for more supplemental portfolio positioning, if appropriate.
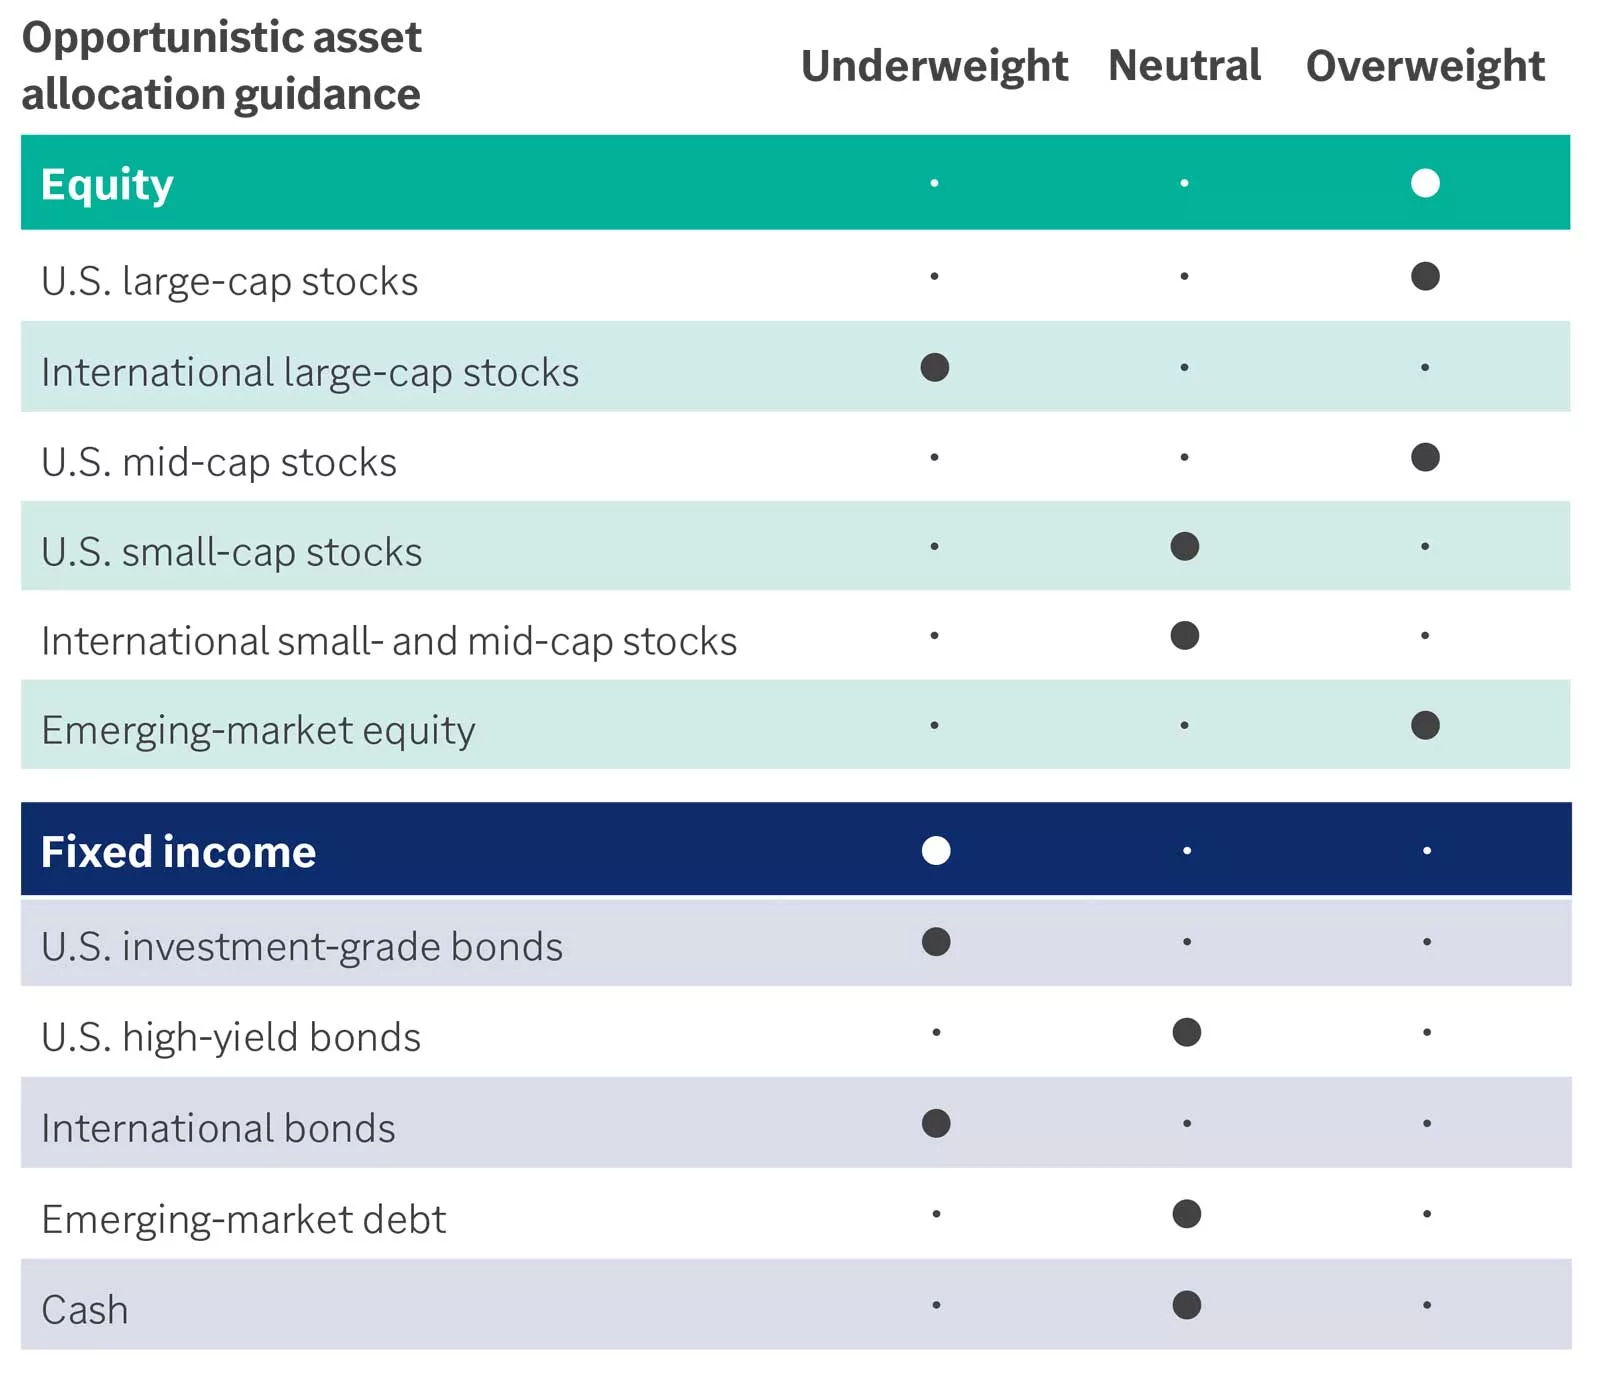
Our opportunistic asset allocation guidance follows: Equity — overweight overall; overweight for U.S. large-cap stocks, U.S. mid-cap stocks and emerging-market equity; neutral for U.S. small-cap stocks and international small- and mid-cap stocks; underweight for international large-cap stocks. Fixed income — underweight overall; neutral for U.S. high-yield bonds, emerging-market debt and cash; underweight for U.S. investment-grade bonds and international bonds.
Our opportunistic asset allocation guidance follows: Equity — overweight overall; overweight for U.S. large-cap stocks, U.S. mid-cap stocks and emerging-market equity; neutral for U.S. small-cap stocks and international small- and mid-cap stocks; underweight for international large-cap stocks. Fixed income — underweight overall; neutral for U.S. high-yield bonds, emerging-market debt and cash; underweight for U.S. investment-grade bonds and international bonds.
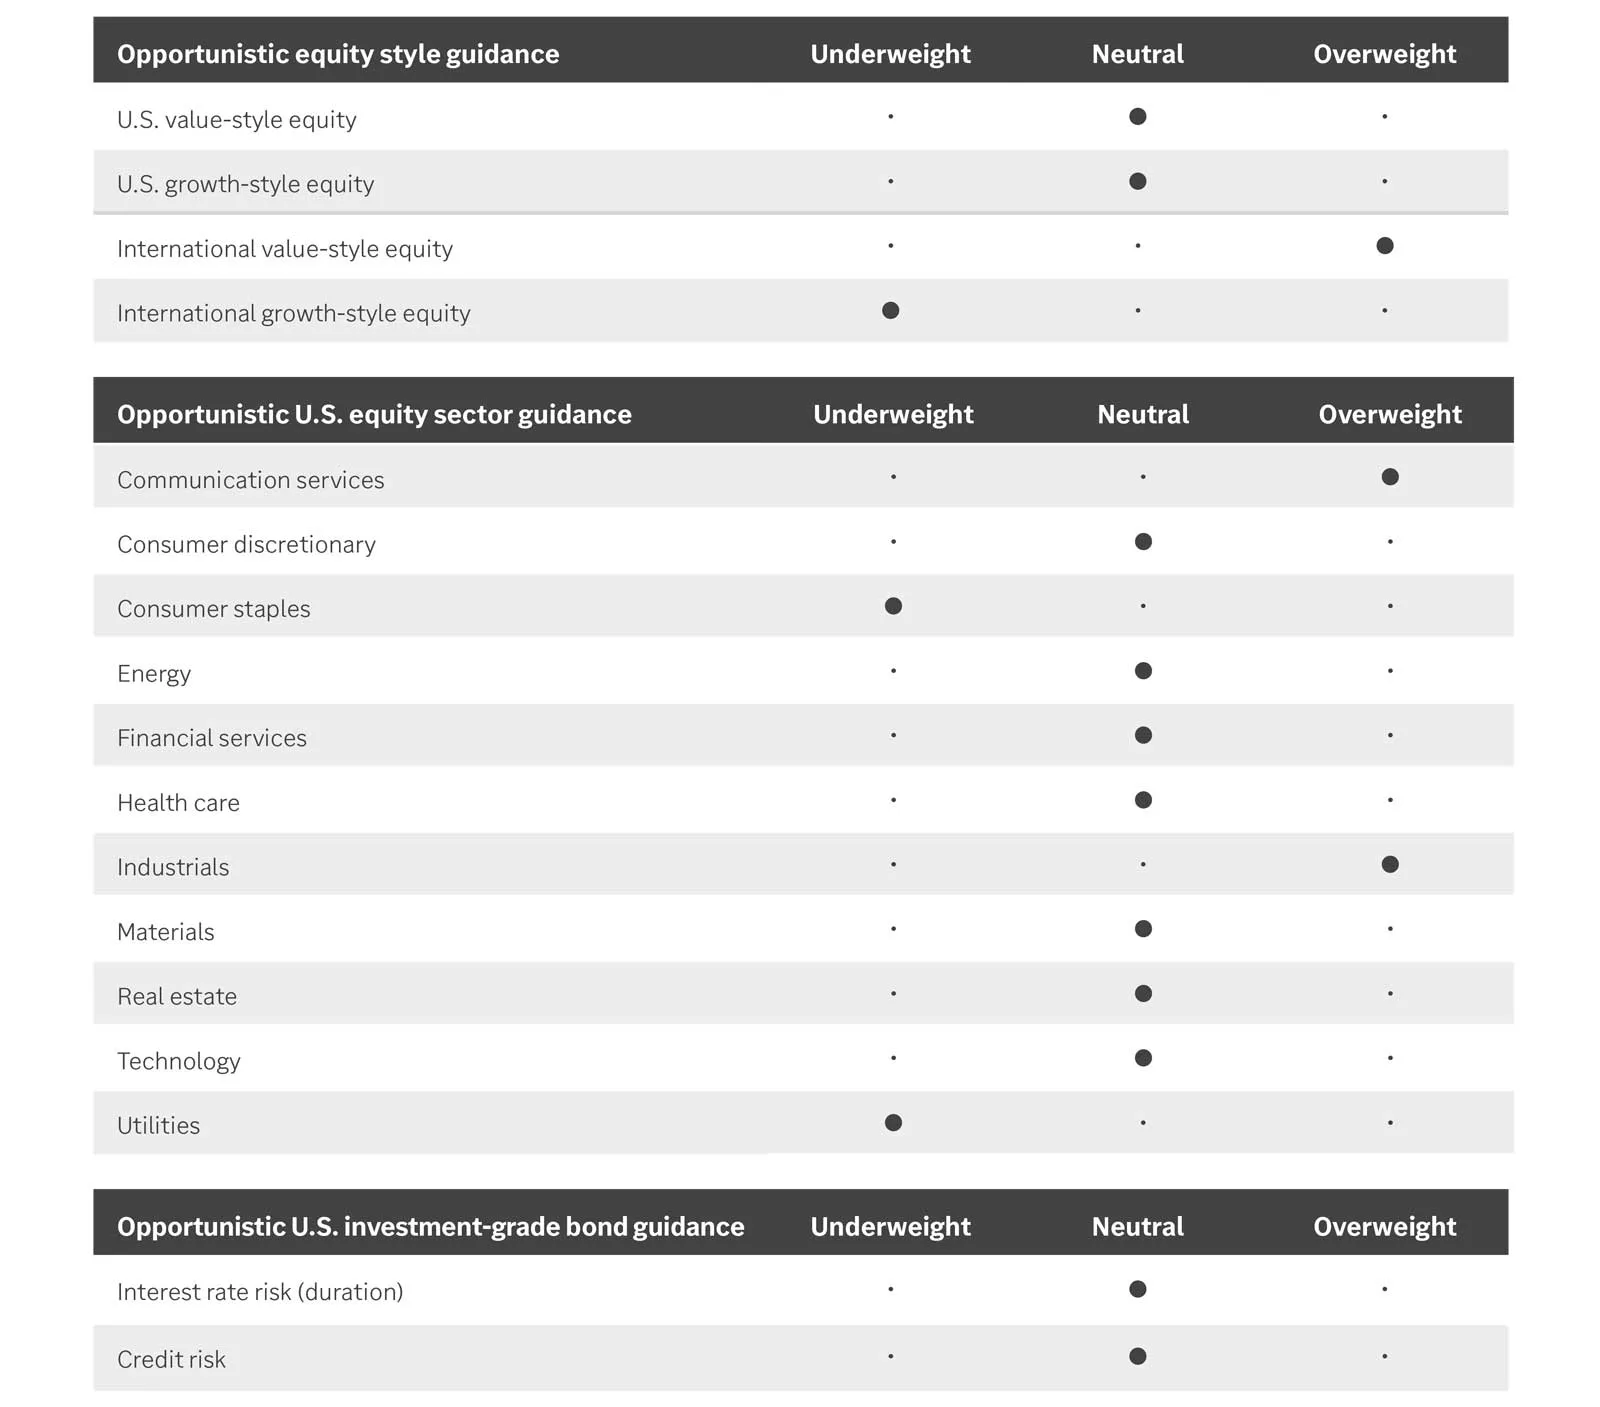
Our opportunistic equity style guidance is overweight international value-style equity; underweight international growth-style equity; neutral for U.S. value-style equity and U.S. growth-style equity. Our opportunistic equity sector guidance follows: • Overweight for communication services and industrials • Neutral for consumer discretionary, energy, financial services, health care, materials, real estate and technology • Underweight for consumer staples and utilities Our opportunistic U.S. investment-grade bond guidance is neutral in interest rate risk (duration) and credit risk.
Our opportunistic equity style guidance is overweight international value-style equity; underweight international growth-style equity; neutral for U.S. value-style equity and U.S. growth-style equity. Our opportunistic equity sector guidance follows: • Overweight for communication services and industrials • Neutral for consumer discretionary, energy, financial services, health care, materials, real estate and technology • Underweight for consumer staples and utilities Our opportunistic U.S. investment-grade bond guidance is neutral in interest rate risk (duration) and credit risk.
Visit our monthly portfolio brief for a discussion of portfolio performance.
Investment performance benchmarks
It’s natural to compare your portfolio’s performance to market performance benchmarks, but it’s important to put this information in the right context and understand the mix of investments you own. Talk with your financial advisor about any next steps for your portfolio to help you stay on track toward your long-term goals.
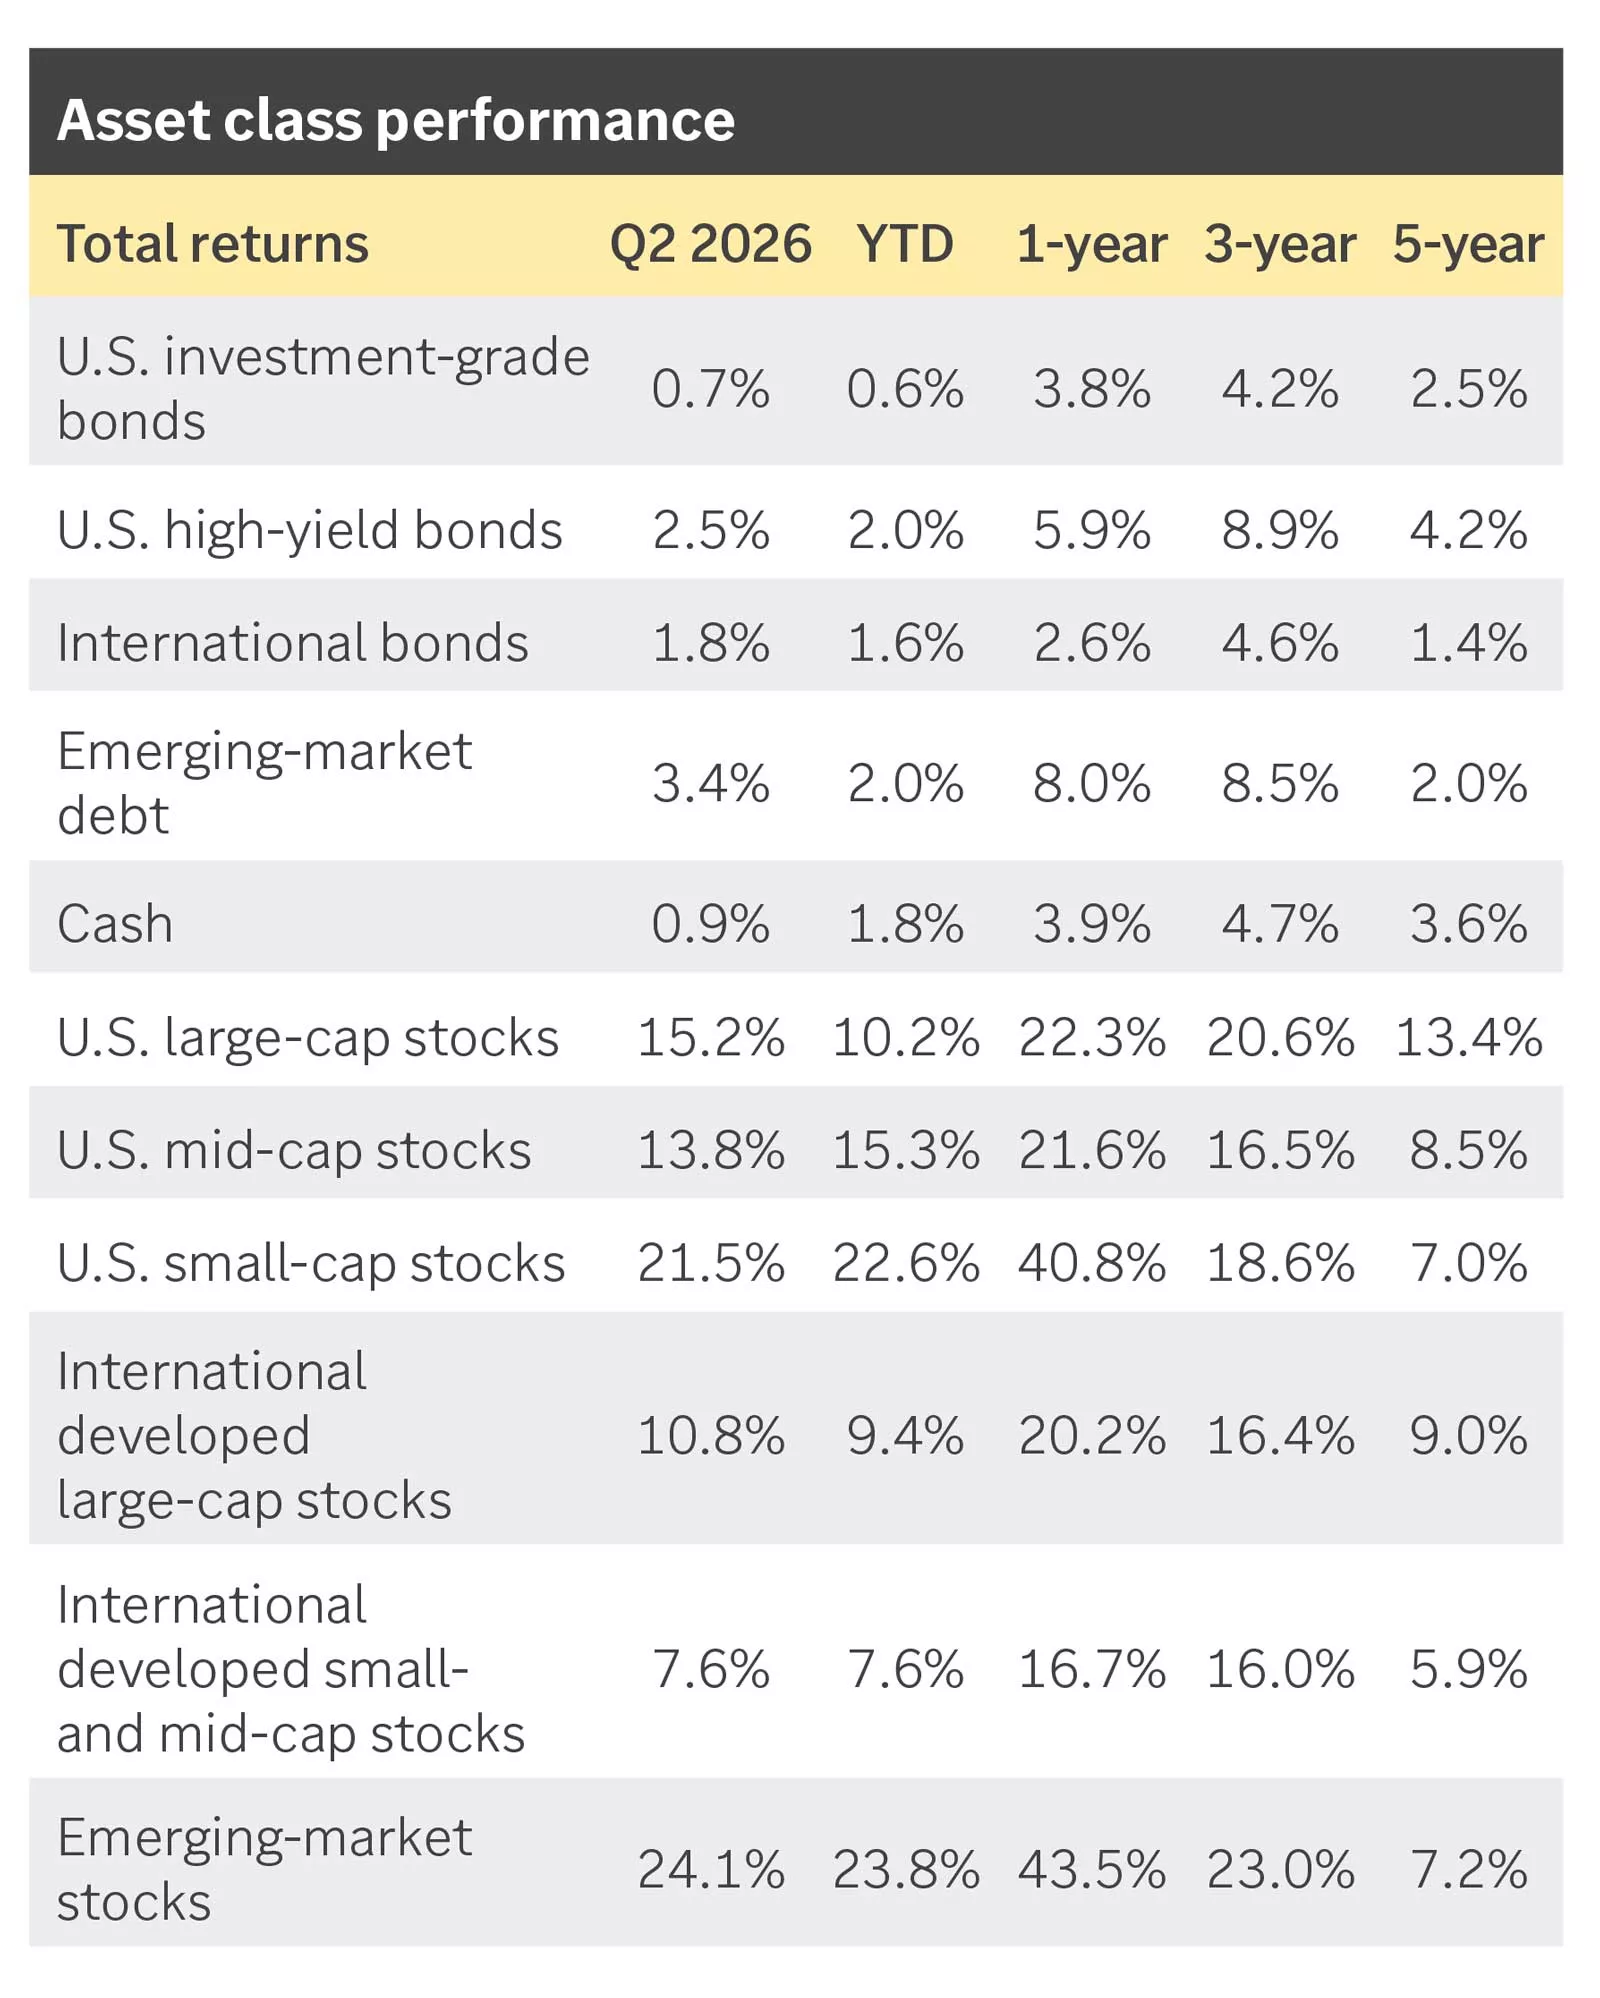
Asset class performance
U.S. equity sector performance
The chart shows the performance of equity and fixed-income asset classes across various time horizons. In 2026, equity asset classes have outperformed bonds though both have seen positive returns.
The chart shows the performance of equity and fixed-income asset classes across various time horizons. In 2026, equity asset classes have outperformed bonds though both have seen positive returns.
Investment Policy Committee
The Investment Policy Committee (IPC) defines and upholds Edward Jones investment philosophy, which is grounded in the principles of quality, diversification and a long-term focus.
The IPC meets regularly to talk about the markets, the economy and the current environment, propose new policies and review existing guidance — all with your financial needs at the center.
The IPC members — experts in economics, market strategy, asset allocation and financial solutions — each bring a unique perspective to developing recommendations that can help you achieve your financial goals.
This report is provided as general information only and should not be interpreted as specific recommendation or investment advice. Investors should make investment decisions based on their unique investment objectives and financial situation. Opinions expressed are as of the date of this report and are subject to change. Diversification does not ensure a profit or protect against loss in a declining market. Investors should understand the risks involved in owing investments, including interest rate risk, credit risk and market risk. The value of investments fluctuates, and investors can lose some or all of their principal. Special risks are inherent in international and emerging-market investing, including those related to currency fluctuations and foreign political and economic events.
Investing in equities involves risks. The value of shares will fluctuate and investors can lose some or all of their principal.
Before investing in bonds, understand the risks involved, including credit risk and market risk. Bond investments are also subject to interest rate risk such that when interest rates rise, the prices of bonds can decrease, and investors can lose principal value if the investment is sold prior to maturity.