Key takeaways:
- Market corrections are normal and historically temporary, often creating attractive opportunities for disciplined long‑term investors.
- Current risks have increased, but underlying economic and policy conditions remain supportive, reducing the likelihood of a bear market, in our view.
- Investor sentiment has already adjusted meaningfully, suggesting much of the downside may be priced in and helping reinforce the value of staying invested.
As the conflict in the Middle East moves beyond its first month, major U.S. equity indexes have come under pressure. The Dow and Nasdaq have entered correction territory, while the S&P 500 has pulled back but has not yet crossed the 10% threshold. Investor attention remains focused on oil prices, as a sustained rise in energy costs could add to inflationary pressures, weigh on economic growth, and further complicate the outlook for central banks.
While the duration and ultimate path of geopolitical tensions remain uncertain, history suggests that periods like these can often be short-lived and may provide opportunities. Understanding how market corrections typically unfold and how investors have successfully navigated them in the past can provide a useful framework for managing today’s volatility.
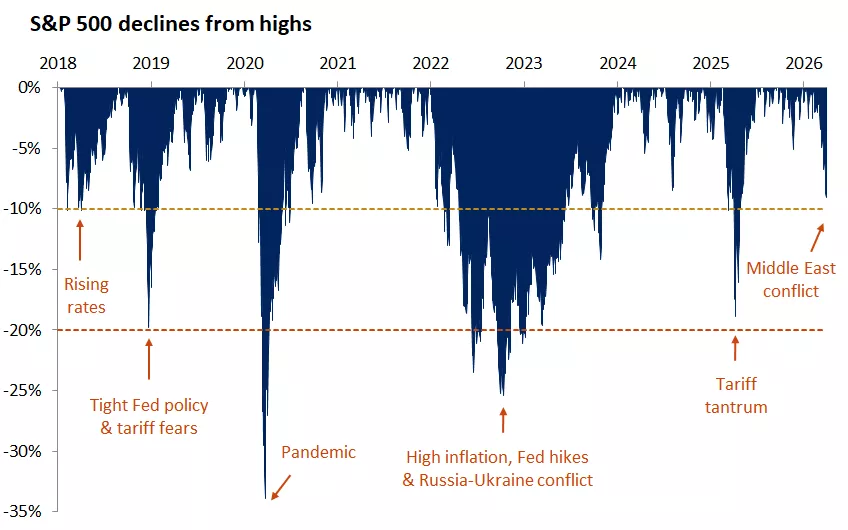
The graph shows the S&P 500 drawdowns since 2018 along with the catalysts driving them.
The graph shows the S&P 500 drawdowns since 2018 along with the catalysts driving them.
What is a market correction, and how often do they occur?
A market correction is defined as a decline of more than 10% but less than 20% from a recent market peak. Although corrections can feel unsettling, they are a normal and recurring feature of investing, occurring roughly once per year on average.
Since 1970, there have been 19 market corrections that did not evolve into bear markets. These pullbacks averaged a decline of 14.7% and lasted about 4.3 months from peak to trough. Importantly, periods like these have historically created attractive entry points for long‑term investors: equities rose an average of 18.4% six months later and 23% one year later.
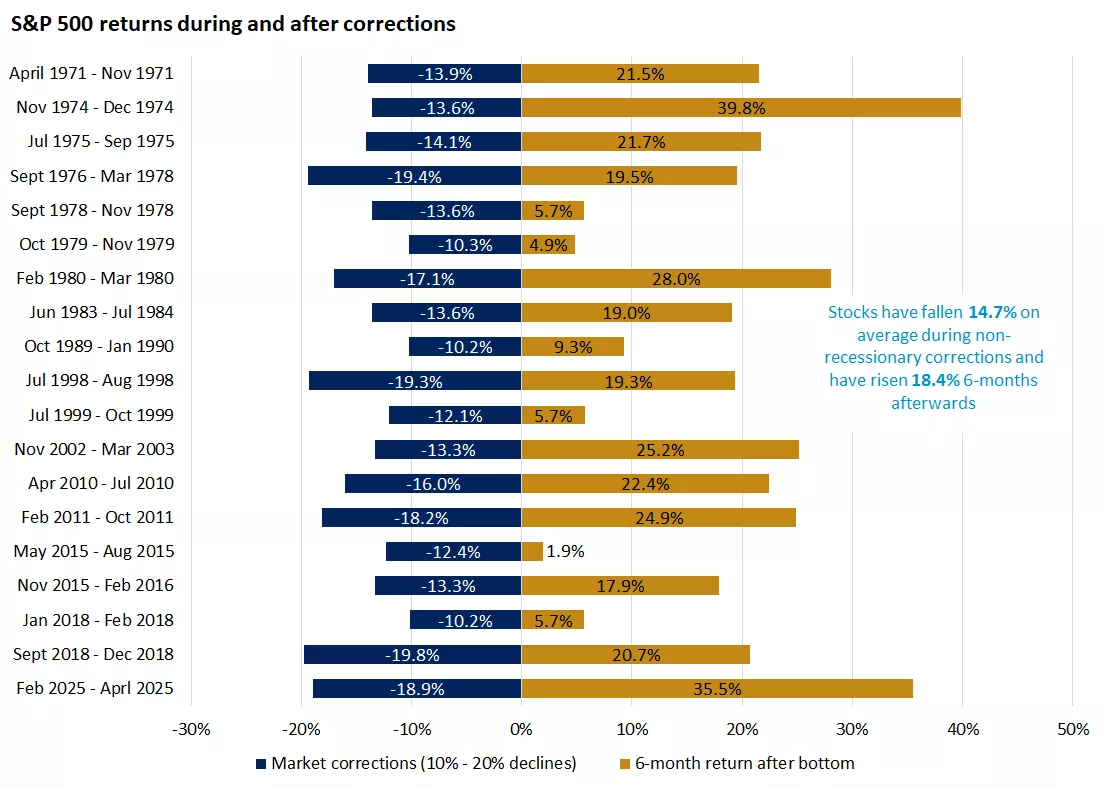
The graph shows S&P 500 corrections without recession since 1970. Stocks have fallen 14.7% on average and have risen 18.4% six months afterwards.
The graph shows S&P 500 corrections without recession since 1970. Stocks have fallen 14.7% on average and have risen 18.4% six months afterwards.
How long do markets take to recover?
The trigger for past corrections has varied, ranging from tight fed policy, economic disappointments, geopolitical uncertainties, the recalibration of lofty expectations, or a combination of these. Despite these differences, the market’s ability to recover has been relatively consistent.
Historically, the S&P 500 has recouped losses approximately four months after reaching a bottom. Deeper pullbacks have typically taken longer to rebound, underscoring the importance of discipline and patience during periods of volatility.
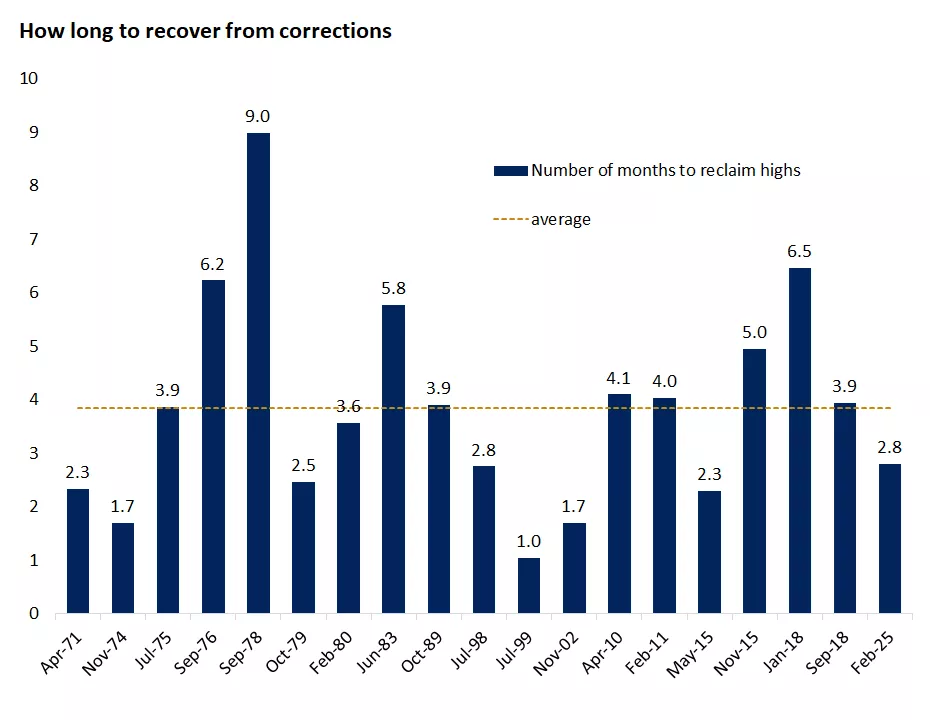
The graph shows how long the S&P 500 took to recover from corrections (10%-20% decline from the peak). Stocks on average reclaimed the prior highs in about four months from the time they bottomed.
The graph shows how long the S&P 500 took to recover from corrections (10%-20% decline from the peak). Stocks on average reclaimed the prior highs in about four months from the time they bottomed.
Why we don’t expect the correction to become a bear market
There is a longstanding adage that bull markets do not end due to age, but rather due to recessions or aggressive Federal Reserve tightening cycles. While risks have risen as energy supply concerns persist, we do not currently expect either a recession or a renewed tightening cycle this year.
Although oil prices have risen, current levels remain comparable to prior spikes over the past 15 years, and underlying fundamentals appear stronger today. Consumers’ disposable income has nearly doubled since 2011, household debt relative to income remains low, unemployment is well below the historical average, and larger tax refunds this year should help provide at least a partial offset to higher energy costs. At the same time, the ongoing AI investment boom and continued innovation are providing an additional source of support for growth.
From a policy standpoint, the Federal Reserve faces a challenging balancing act—managing downside risks to the labor market against upside inflation risks. However, Fed officials maintained at least one rate cut in their March projections, signaling a willingness to look through a one‑time energy‑related inflation boost. Unlike in 2022, when energy prices surged following Russia’s invasion of Ukraine, today’s labor market is no longer overheated, policy is no longer easy, and fiscal stimulus is more modest.
Has investor sentiment adjusted to the risks?
Trying to time the market tops and bottoms is often an exercise in futility, as markets and sentiment often overshoot in both directions. Market bottoms are typically a process rather than a single event, with prices stabilizing after a period of decline before a recovery takes hold.
- Since the January peak, the S&P 500’s forward price‑to‑earnings ratio has declined by more than 15%, leaving U.S. large‑cap stocks trading below their five‑year average and roughly in line with their 10‑year average.
- Volatility has risen sharply, with the VIX index—the so‑called “fear gauge”—above 30, nearing levels that have historically preceded strong six‑ and 12‑month forward returns. These outcomes are not driven by volatility itself, but rather by the fact that spikes in volatility often reflect pessimism that has already been priced into markets.
- Investor sentiment surveys tell a similar story. The AAII Investor Sentiment Survey shows the bulls‑to‑bears ratio falling from 1.8 in January to 0.65 today. Sentiment tends to be a contrarian indicator, with complacency usually preceding market pullbacks and skepticism laying the groundwork for future gains.
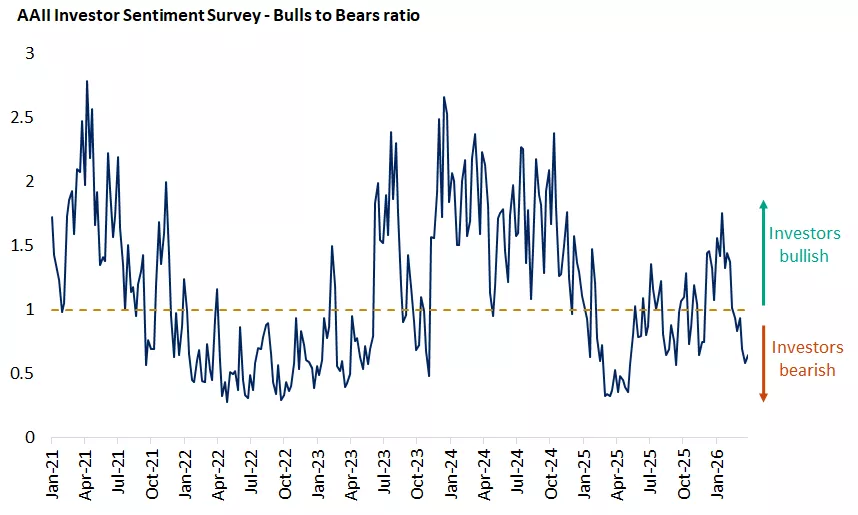
The graph shows the bulls-to-bears ratio of AAII investor sentiment survey which often is a contrarian indicator at extremes.
The graph shows the bulls-to-bears ratio of AAII investor sentiment survey which often is a contrarian indicator at extremes.
Five principles for navigating market corrections
- Avoid panic. Emotional reactions during market downturns often result in poor timing and missed opportunities.
- Let your goals guide your decisions. Headlines can be overwhelming, but we think goals, not short‑term market moves, should guide investment decisions.
- Put time on your side. Long-term investors are blessed with the advantage of time, so make sure that you’re evaluating the performance of your portfolio and your ultimate achievement of your goals over a longer period.
- Leverage the power of diversification and balance . You can’t dodge every twist and turn, or every dip in the stock market, but we think having a diversified portfolio that’s balanced can ultimately help you navigate it in a smoother fashion.
- Be opportunistic. Given that the broader economic foundation remains solid, in our view, periods of volatility may offer opportunities to add high‑quality investments at more attractive prices.
Angelo Kourkafas, CFA
Investment Strategist
Data for all sources in the commentary: Bloomberg, FactSet
Angelo Kourkafas
Angelo Kourkafas is responsible for analyzing market conditions, assessing economic trends and developing portfolio strategies and recommendations that help investors work toward their long-term financial goals.
He is a contributor to Edward Jones Market Insights and has been featured in The Wall Street Journal, CNBC, FORTUNE magazine, Marketwatch, U.S. News & World Report, The Observer and the Financial Post.
Angelo graduated magna cum laude with a bachelor’s degree in business administration from Athens University of Economics and Business in Greece and received an MBA with concentrations in finance and investments from Minnesota State University.
Important Information:
This is for informational purposes only and should not be interpreted as specific investment advice. Investors should make investment decisions based on their unique investment objectives and financial situation. While the information is believed to be accurate, it is not guaranteed and is subject to change without notice.
Investors should understand the risks involved in owning investments, including interest rate risk, credit risk and market risk. The value of investments fluctuates and investors can lose some or all of their principal.
Investing in equities involves the risk of loss. The value of an investors shares can fluctuate, and investors can lose money. Small-and mid-cap stocks tend to be more volatile than large company stocks.
Past performance does not guarantee future results.
Market indexes are unmanaged and cannot be invested into directly and are not meant to depict an actual investment.
Diversification does not guarantee a profit or protect against loss in declining markets.
Dividends may be increased, decreased or eliminated at any time without notice.
Special risks are inherent in international investing, including those related to currency fluctuations and foreign political and economic events.
Before investing in bonds, you should understand the risks involved, including credit risk and market risk. Bond investments are also subject to interest rate risk such that when interest rates rise, the prices of bonds can decrease, and the investor can lose principal value if the investment is sold prior to maturity.