Reviewing your investment performance over time is important when tracking your progress toward your financial goals. However, before evaluating your performance, you’ll first need to determine the return needed to achieve your objectives.
To help put your investment performance into perspective, your return expectations should be:
- Relevant: Based on the goals you‘re trying to achieve (and not a market index)
- Realistic: Based on your asset allocation, comfort with risk, the market environment and your investment time horizon
- Reviewed: Evaluated over time to help ensure you remain on track to reach your goals
Ultimately, your actual investment return should be compared to the return necessary to help achieve your financial goals.
The challenges of comparing performance to a market index
Some investors compare their portfolio returns to a broad index, such as the S&P 500, and then question why they underperformed or outperformed the index at certain times. Though these individual indexes can provide insight into the general performance of stocks or bonds, they are usually not a relevant comparison to your portfolio’s performance. It’s important to consider that:
- A market index doesn’t account for your personal goals or comfort with risk. For example, if your goal is to produce retirement income, you’d likely have a mix of equities and fixed-income investments. But measuring your portfolio’s returns against those of a stock index wouldn’t be an appropriate comparison, since your portfolio would include the risk and returns associated not only with stocks but with fixed-income investments as well.
- Indexes are generally not diversified across different types of investments. That’s why they often have wider swings in value compared to a well-diversified portfolio. To achieve the extreme highs of an index, you also must be willing to accept the extreme lows.
- Your performance is affected by your contributions and withdrawals, while market index returns are not. Investing also carries expenses and fees that are not included in index returns. Ultimately, your investment portfolio should be designed to help you reach specific financial objectives, so its performance should be evaluated against the return you need to reach them.
Your return expectations should be relevant
First and foremost, your return expectations should be relevant, meaning they should be based on your specific goals. These goals should be established by working with your financial advisor. When you’re unsure of what you’re aiming for, it can be difficult to know whether you’re on target or if adjustments need to be made.
Once you’ve set your goals — for example, retiring at age 60 or helping fund half of your child’s college expenses — work with your financial advisor to determine the return you’ll need to achieve them. Then, when you’re evaluating your performance, your actual return should be compared to this return — the return you need to help achieve your goals, not the market’s return.
Your return expectations should be realistic
While most people want to earn very high returns with minimal risk, this is unrealistic. In general, your portfolio’s return will depend on several factors, including the market environment, your asset allocation (your mix of investments) and your investment holding period.
- Market environment — Consider your return expectations in light of our long-term outlook for economic growth, corporate profits, inflation and interest rates to help ensure your forward-looking estimates remain realistic. As economic and market conditions change, our return expectations will as well. So, it’s important to review this outlook periodically.
- Asset allocation — Your portfolio’s allocation to different asset classes can determine as much as 90% of how your returns may vary over time.1 If you own a well-diversified portfolio with exposure to many different asset classes, your expected return should be a blend of our expectations for each. Your asset allocation should align with your long-term financial goals and your comfort with risk. For example, the greater the return you need to meet your goals, the more you should consider investing in stocks. However, risk and return go hand in hand, so the more you invest in stocks, the higher the risk (or chance for higher volatility) you’ll take on.
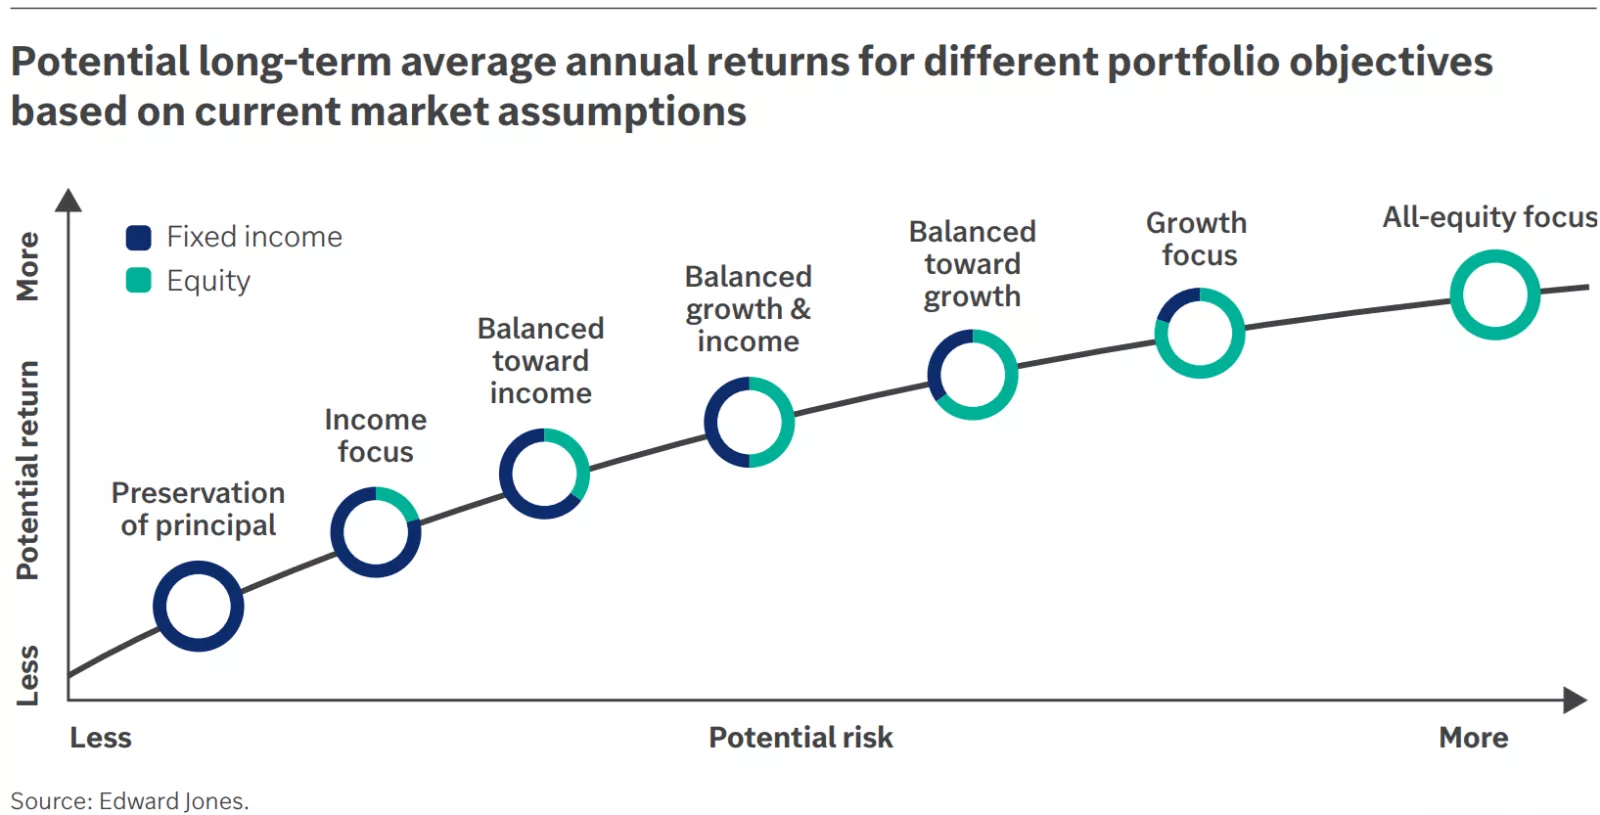
This graphic demonstrates the trade-off between risk and return. Higher return is typically accompanied by higher risk. Over the long run, we expect equities to provide potential for higher returns than bonds, but they are also generally more volatile and subject to greater risk than bonds. The amount of equity increases as you move across portfolio objectives on the graphic from left to right, which increases estimated returns as well as estimated risk.
This graphic demonstrates the trade-off between risk and return. Higher return is typically accompanied by higher risk. Over the long run, we expect equities to provide potential for higher returns than bonds, but they are also generally more volatile and subject to greater risk than bonds. The amount of equity increases as you move across portfolio objectives on the graphic from left to right, which increases estimated returns as well as estimated risk.
- Investment holding period — The market rarely has an average year, so you shouldn’t expect to hit your long-term average annual return estimate every year. For example, though the S&P 500 has seen an average annual return of about 10% since 1926, there have been only six times when its annual return has been between 8% and 12%, equating to an occurrence of less than 10% over 98 years.2
Additionally, when reviewing your historical return, consider the market environment over that same period. It’s important to connect what’s happening across the market to your portfolio. Focusing on what you can control and sticking to your long-term financial strategy during short-term market dislocations can help keep you on track.
The importance of a long-term focus
| 100% U.S. stocks | 65% stocks / 35% bonds | |||
| Rolling period | Odds of positive returns | Lowest return over period | Odds of positive returns | Lowest return over period |
| 1 month | 65.4% | -21.5% | 66.9% | -14.6% |
| 1 year | 81.7% | -43.3% | 83.4% | -28.0% |
| 3 years | 88.3% | -16.1% | 91.1% | -7.4% |
| 5 years | 89.8% | -6.6% | 99.4% | -2.3% |
| 10 years | 94.3% | -3.4% | 100.0% | 0.35% |
Source: Morningstar Direct, 1/1/1980–12/31/2024. U.S. stocks represented by the S&P 500 TR USD Index. Bonds represented by the Bloomberg US Aggregate TR USD Index. An index is unmanaged, not available for direct investment and not meant to predict an actual investment. The 65% stocks/35% bonds portfolio was rebalanced at the beginning of each year. Three-, five- and 10-year lowest returns annualized. We assume reinvestment of interest and dividends back into the indexes. For illustrative purposes only, not a portfolio available for investment. Calculations do not include the impacts of trading, liquidity, costs, fees or taxes a client can experience when investing, which would lower performance results. Past performance does not guarantee future results. Diversification and rebalancing do not ensure a profit or protect against a loss in a declining market.
While short-term returns can fluctuate, the table above shows that, in general, the longer you own your investments, the more likely your returns will be positive and the closer your return could be to the long-term average. The table also highlights how volatility, or the amount a portfolio fluctuates, may differ when the asset allocation is different.
While a greater stock allocation may lead to a higher long-term expected return, you should also expect more volatility, especially in the short term. As you evaluate your portfolio’s performance, you should compare its long-term returns to the rate you determined you needed to reach your financial goals — paying less attention to short-term performance differences along the way.
Your return objectives should be reviewed
You and your financial advisor should conduct a thorough review of your portfolio and financial position, including your personal rate of return, at least annually. Regular performance reviews over time can help determine whether you’re making progress toward achieving your financial goals.
During your review, you may confirm everything is going according to plan. If not, you may decide to make some changes, such as:
- Rebalancing your portfolio — Bringing your investments back into alignment with your objectives and comfort with risk
- Adjusting your asset allocation — To align with changes to your goals
Remember that even though performance can be volatile in the short run, your decisions should be made with a long-term outlook in mind, not in reaction to short-term fluctuations.
While reviewing your performance is a crucial step, it’s only part of the overall review process. You should also review your overarching goals and objectives because any changes to these could influence your return objectives. This could also mean adjusting your saving or spending — or potentially working longer — to help you reach your long-term financial goals.Your ro
Your role in your portfolio’s performance
One of the biggest obstacles to reaching our long-term goals isn’t investment performance, it’s our own actions. Investors tend to overreact to short-term market volatility and chase performance — buying investments that recently performed well and selling those that didn’t — instead of sticking with a long-term strategy.
Chasing performance is a recipe for underperformance, according to a 2025 investor behavior study by DALBAR. The average investor’s portfolio performed much worse overall than the S&P 500 over the past 30 years. This didn’t happen because investors owned the wrong investments but because they chased performance: They bought investments when they were up and sold after the value dropped. Tracking and reviewing performance is important, but it can be a double-edged sword.
Don’t let your reaction to short-term swings in the market get in the way of achieving your long-term goals.
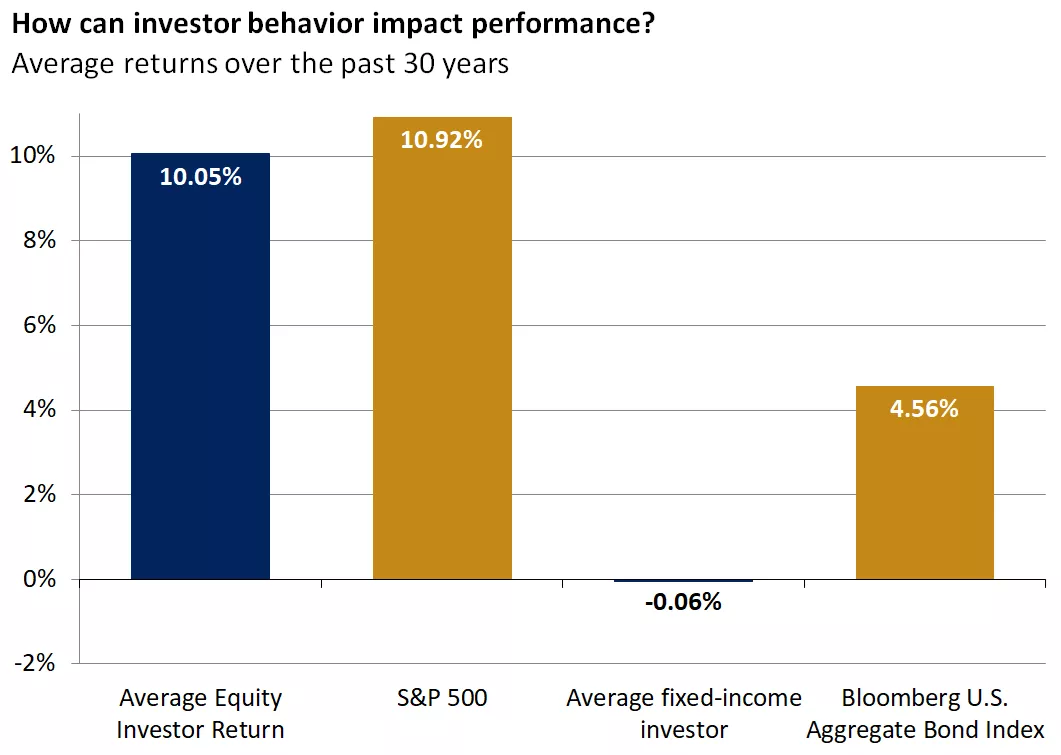
This chart shows the average performance of the S&P 500 and Bloomberg U.S. Aggregate Bond Index over the past 30-years relative to the average performance of equity and fixed-income fund investors. The S&P 500 and Bloomberg U.S. Aggregate Bond Index have outperformed the average investor.
This chart shows the average performance of the S&P 500 and Bloomberg U.S. Aggregate Bond Index over the past 30-years relative to the average performance of equity and fixed-income fund investors. The S&P 500 and Bloomberg U.S. Aggregate Bond Index have outperformed the average investor.
How are you doing?
We recommend reviewing your goals and objectives with your financial advisor at least once a year as well as when your personal situation changes. Your financial advisor can help you review your current performance in the context of your long-term goals and our expectations for future performance.
More important, you’ll review how that performance affects progress toward your long-term goals and whether any changes need to be made to help keep you (or help put you back) on track. Ultimately, the best way to measure performance is by comparing it to the progress you have made toward reaching your financial goals.
Source:
1. “Determinants of Portfolio Performance II: An Update,” Gary P. Brinson, Brian D. Singer and Gilbert L. Beebower, Financial Analysts Journal, 1991.
2. FactSet, S&P 500 Price Return Index.
Guidance and Perspectives
Get insights from our strategists and see what their perspectives mean for you.
Important information:
Edward Jones, its employees and financial advisors cannot provide tax or legal advice. You should consult your attorney or qualified tax advisor regarding your situation.