Geopolitics Grabs Attention, but AI Sets the Direction
Key Takeaways:
- Geopolitics remain a source of volatility following renewed U.S.-Iran tensions. Oil prices still matter, but their grip on stocks has weakened, with markets less sensitive to headline noise than earlier in the year.
- Instead, attention remains focused on AI, where strong earnings and recent bouts of volatility continue to shape market leadership.
- AI spending is being questioned, but demand and tech earnings remain strong. Given high concentration and elevated expectations, we recommend investors maintain exposure to tech but complement it with differentiated sources of return.
- Second-half U.S. leadership is likely to broaden, in our view, favoring a more balanced mix of AI, cyclicals, and diversified exposures, including U.S. mid-caps, industrials, and communication services.
If investors needed a reminder that geopolitics and AI have been this year’s key market drivers, the start of July and the third quarter provided one. Renewed tensions in the Middle East pushed oil prices higher, but the stock-market reaction was contained, suggesting investors are treating the latest flare-up as a source of near-term headline risk rather than a shift in the broader market outlook. Instead, attention remains focused on AI, where strong earnings and recent bouts of volatility continue to shape market leadership. We offer the following perspective on recent geopolitical developments, the evolving rotation within technology, and portfolio positioning for the second half of the year.
Geopolitics are still a wildcard but not a game changer
Energy markets are back in the spotlight after renewed tensions between the U.S. and Iran raised the prospect of an end to peace talks and a return to fighting, though the door to further negotiations appears to remain open. Iran resumed attacks on commercial ships in the Strait of Hormuz, the U.S. launched a fresh wave of strikes and revoked Iranian oil waivers, and Iran retaliated by striking military bases in Kuwait and Bahrain. In response, oil prices rose briefly 5% last week to about $72 per barrel, but remain well below the $120 peak reached in March and only modestly above pre-conflict levels.
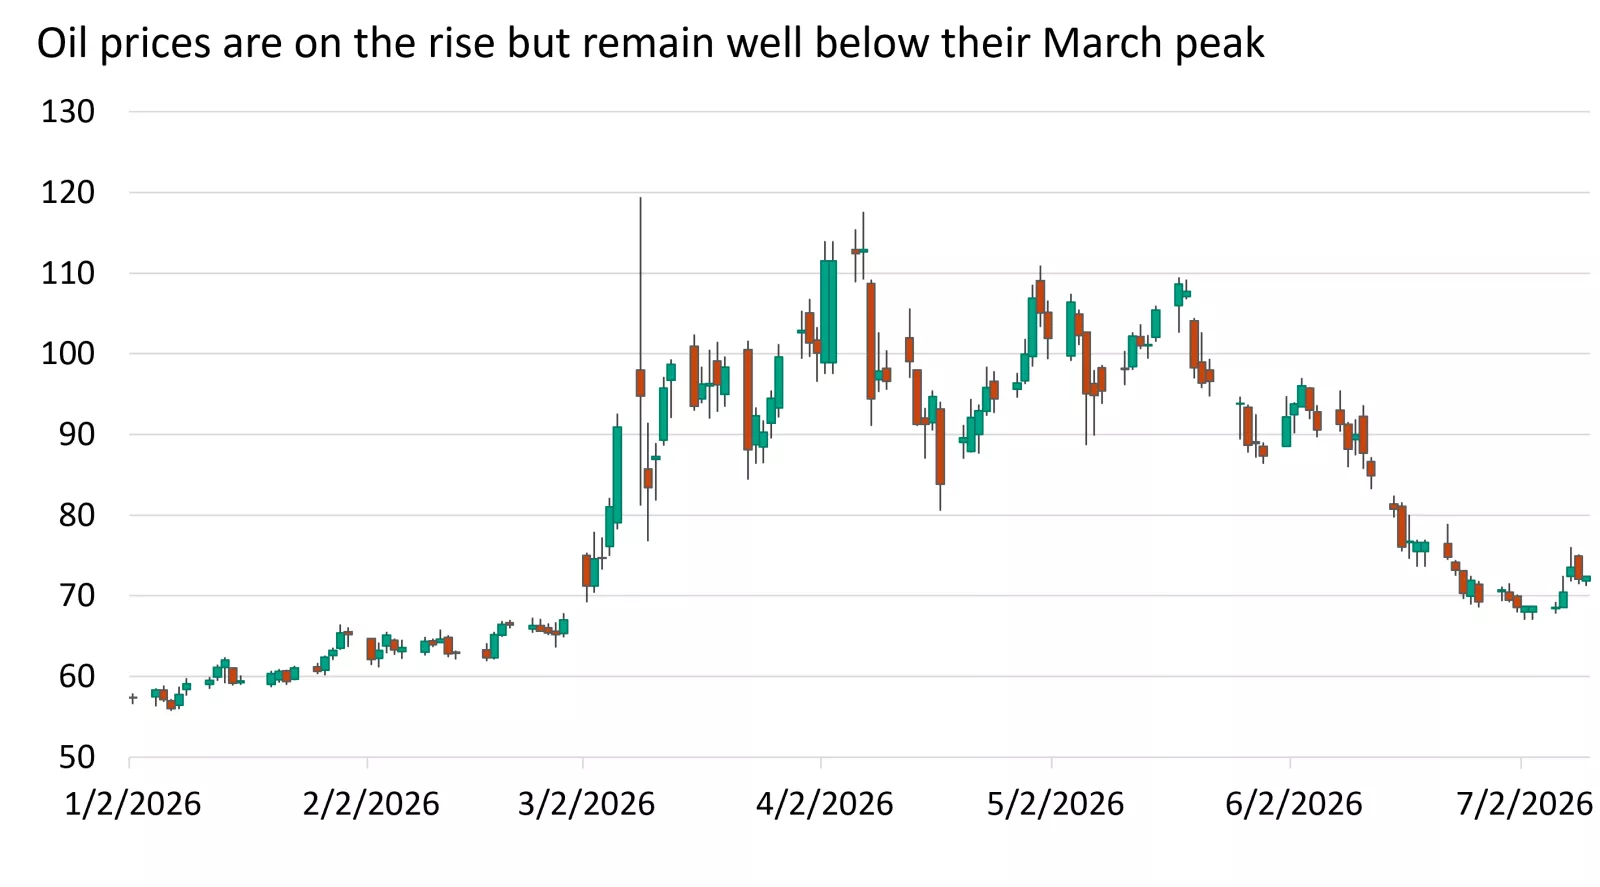
The graph shows a roundtrip in oil prices this year. Renewed geopolitical tensions have lifted prices, but they remain well below their March peak. Past performance does not guarantee future results.
The graph shows a roundtrip in oil prices this year. Renewed geopolitical tensions have lifted prices, but they remain well below their March peak. Past performance does not guarantee future results.
Geopolitical uncertainty contributed to a nearly 10% correction in the first half of the year, but it also highlighted the economy’s resilience to these shocks. Renewed geopolitical risk could still fuel near-term risk-off sentiment, particularly through higher oil prices, bond yields and inflation expectations. However, we do not expect investors to react to this round of uncertainty the same way they did in March, for several reasons:
- Neither the U.S. nor Iran appear inclined toward a prolonged conflict. Investors have also seen how overreacting to fast-moving headlines can lead to suboptimal portfolio outcomes. In fact, leaning into geopolitical-driven pullbacks has historically (and this year) been a better strategy than chasing them.
- Since the ceasefire between the U.S. and Iran went into effect in mid-June, oil supplies have begun to recover, providing a renewed buffer for energy markets. OPEC has increased production quotas, and Iran appears to have moved large amounts of oil out of the gulf, with reports estimating that roughly 60 million barrels of Iranian oil are currently at sea. In addition, the reinstated U.S. sanctions on Iranian oil may have a limited impact, as China will likely remain a willing buyer.
- It would likely take a much larger and sustained rise in oil prices to materially alter the outlook for the economy and corporate earnings, in our view. The labor market has remained steady and has recently shown signs of improvement, supporting household incomes even as the tailwind from higher tax refunds fades. At the same time, corporate earnings continue to benefit from AI-related infrastructure spending, resilient demand, and growing margins.
Market behavior also suggests oil prices have had a weaker grip on equities in recent months. In March, the S&P 500 declined on 10 of the 12 days when WTI rose more than 3%, with an average decline of roughly 0.7%. From April through June, the S&P 500 declined on 8 of the 12 days when oil rose more than 3% but the average decline was much smaller, closer to 0.2%. In other words, oil spikes still matter, but the market has become less sensitive to them.
The bottom line: U.S.-Iran tensions may continue to push oil prices and bond yields higher in the near term, but stocks appear less vulnerable to oil spikes than they were earlier this year. More importantly, the market has a powerful counterweight in AI and earnings momentum, in our view, which remain more durable and influential drivers of market direction.
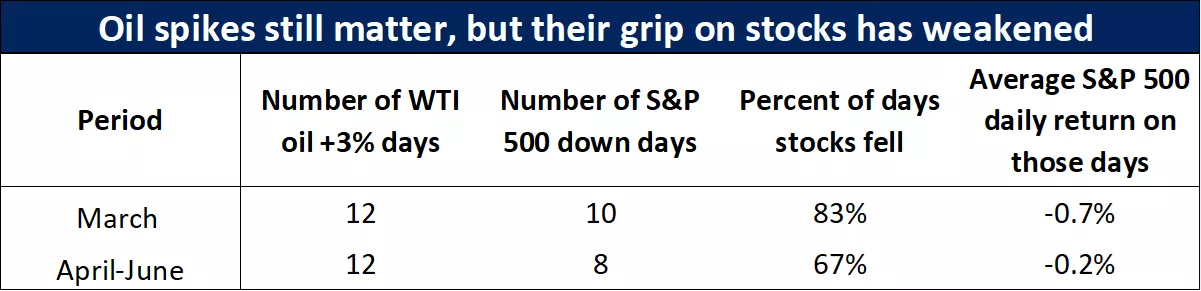
The table shows that oil spikes still matter, but their impact on stocks has diminished, with smaller average equity declines following sharp oil moves in recent months. Past performance does not guarantee future results. An index is unmanaged, cannot be invested into directly and is not meant to depict an actual investment.
The table shows that oil spikes still matter, but their impact on stocks has diminished, with smaller average equity declines following sharp oil moves in recent months. Past performance does not guarantee future results. An index is unmanaged, cannot be invested into directly and is not meant to depict an actual investment.
AI remains a powerful force, but volatility is picking up
The U.S. semiconductor index just wrapped up its best quarter on record, gaining 88%. However, the third quarter began with a pullback across the sector. The high-flying KOSPI, the Korea index that at one point had doubled this year, has since declined 20% from its peak, entering bear-market territory. The index is heavily weighted toward two companies central to AI development, Samsung and SK Hynix, which together account for nearly 55% of its composition, amplifying moves in both directions.
More broadly, AI-related stocks have become more volatile as investors increasingly question the pace and payoff of spending. We are seeing signs of fatigue, with end-user demand for AI becoming more price sensitive and the market starting to penalize companies that ramp spending too aggressively. However, there are no signs, in our view, of a slowdown in demand or spending yet. Given the positive fundamental trends outlined below, we view this volatility as a signal that the AI theme is likely maturing rather than breaking, which is a healthy part of how transformative investment cycles evolve.
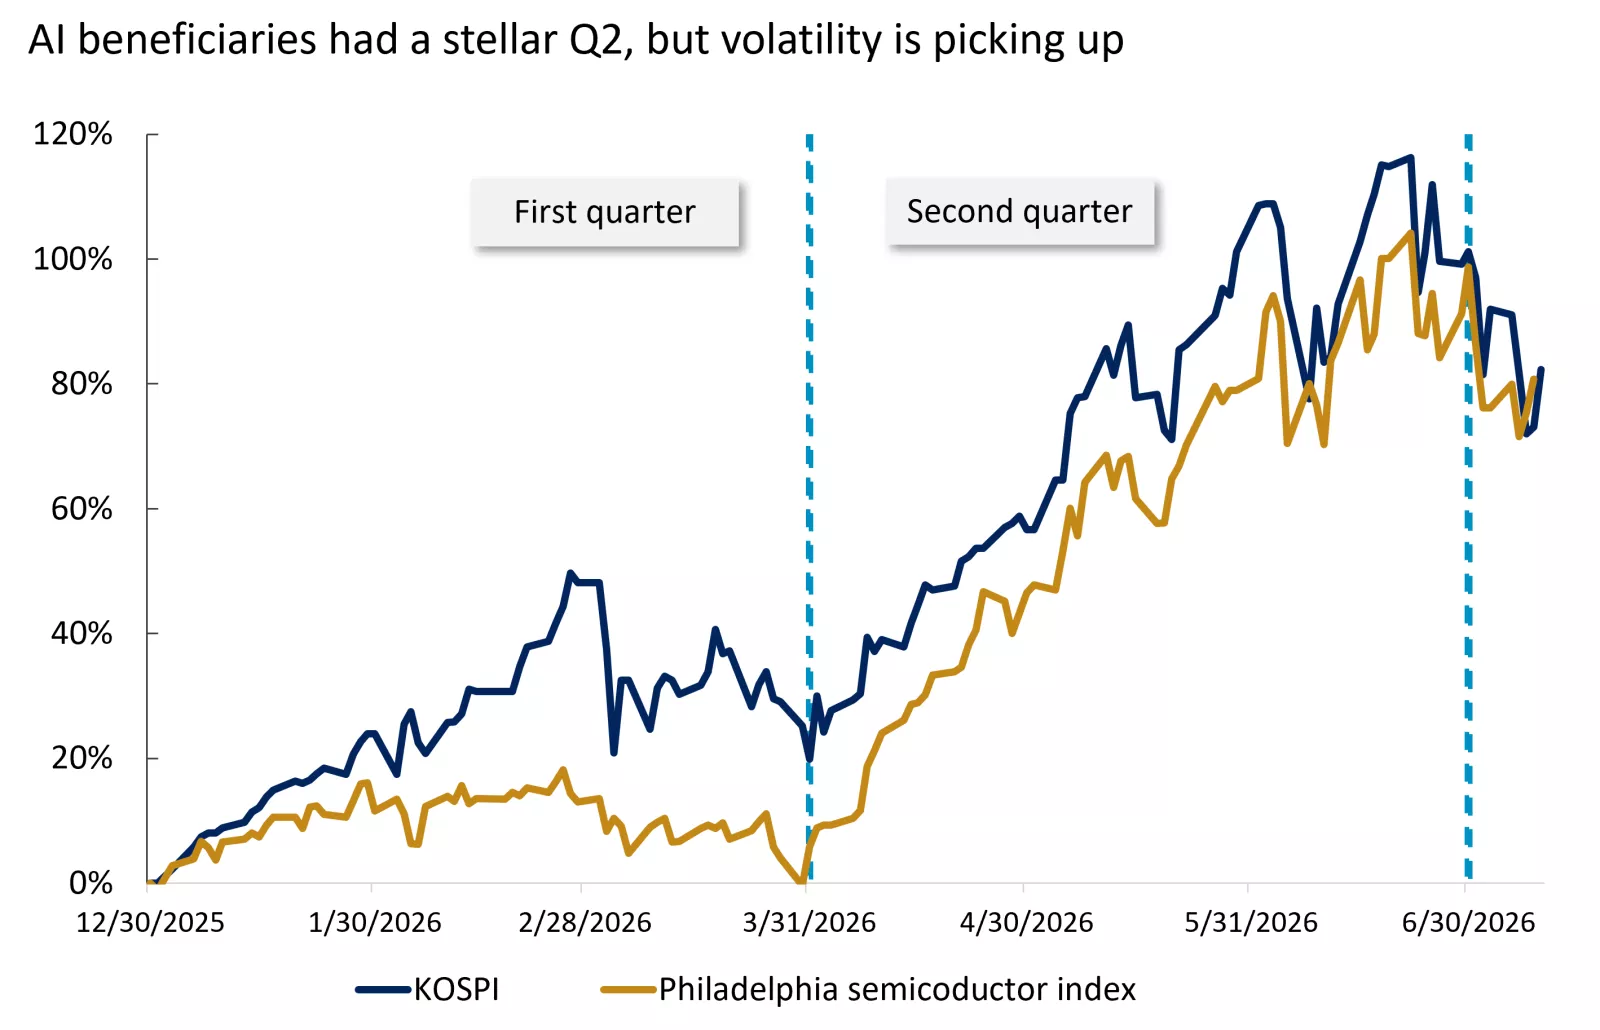
The chart shows strong gains for AI beneficiaries in Q1 and Q2, followed by increased volatility as we start the third quarter, with the KOSPI and the Philadelphia semiconductor index both experiencing sharper swings. Past performance does not guarantee future results. An index is unmanaged, cannot be invested into directly and is not meant to depict an actual investment.
The chart shows strong gains for AI beneficiaries in Q1 and Q2, followed by increased volatility as we start the third quarter, with the KOSPI and the Philadelphia semiconductor index both experiencing sharper swings. Past performance does not guarantee future results. An index is unmanaged, cannot be invested into directly and is not meant to depict an actual investment.
Tech earnings are still doing the heavy lifting
To assess the durability of the support AI has provided to markets, we are watching corporate earnings, which tend to be the most lasting driver of equity performance. So far, we think the message is encouraging and pushes back against the idea that the AI rally is purely speculative.
Second-quarter earnings season unofficially kicks off with the banks on July 14, followed by industrials and many of the mega-cap technology companies later in the month. S&P 500 earnings are expected to grow 23% year-over-year, which would mark the second consecutive quarter of earnings growth above 20%. Revenue growth is expected to reach 12%, and earnings estimates have been revised higher during the quarter, an unusual development given that estimates are typically reduced as reporting season approaches.
Technology and energy have been the two primary drivers of these upward revisions. Technology is expected to deliver the highest revenue growth of all 11 S&P 500 sectors and the second-highest earnings growth rate, at 63%. Energy is also expected to contribute meaningfully, helped by higher oil prices during the quarter. Together, the two sectors are expected to drive roughly 80% of total S&P 500 earnings growth.
The caveat is that the bar is high. Strong earnings growth alone may not be enough if results merely meet elevated expectations. From here, we think investors will likely focus less on whether earnings are growing and more on whether the pace of improvement is still accelerating. In that sense, the second quarter may mark a peak in the rate of change, even if companies continue to deliver double-digit earnings growth in the second half of the year.
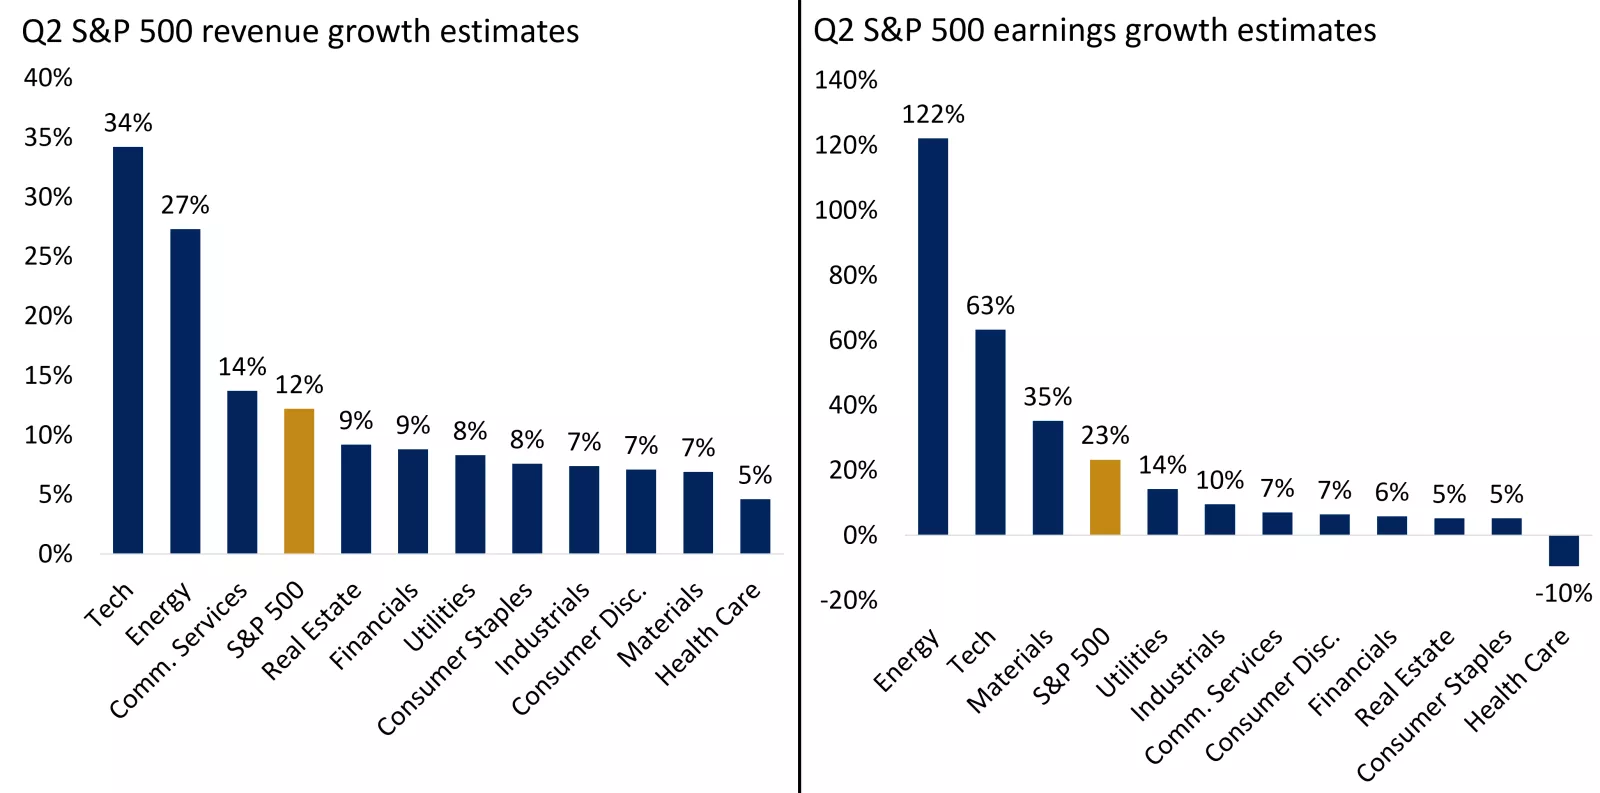
The charts show broad-based Q2 growth, led by technology and energy, with technology driving the majority of the S&P 500 earnings upside. An index is unmanaged, cannot be invested into directly and is not meant to depict an actual investment.
The charts show broad-based Q2 growth, led by technology and energy, with technology driving the majority of the S&P 500 earnings upside. An index is unmanaged, cannot be invested into directly and is not meant to depict an actual investment.
Portfolio positioning for the remainder of the year
Rotations both within technology and beyond technology are likely to be a defining feature of markets in the second half of the year, in our view. AI and semiconductors remain key drivers of market performance, supported by strong earnings growth and continued investment across the AI supply chain. However, after the sharp moves in many AI-related stocks, concentration risk has increased and the technology sector now carries an outsized weight in the broader index. In our view, investors should maintain exposure to the AI theme within U.S. allocations but complement it with more diversified and differentiated sources of return.
- For cyclical exposure, we favor mid-caps and industrials. These areas should benefit from resilient economic growth, infrastructure spending, the onshoring of manufacturing, and the continued adoption of automation and robotics. They also provide exposure to parts of the market that could participate if leadership broadens beyond mega-cap technology.
- For AI exposure outside traditional technology, we continue to like Communication Services. We believe the sector offers meaningful exposure to AI beneficiaries, but valuations are less stretched relative to history, and earnings growth is expected to remain robust. In our view, this provides a more balanced way to participate in the AI theme without relying solely on the most crowded areas of the market.
- More broadly, we expect the second half to look different than the first. Market leadership is likely to broaden, volatility may normalize from low levels, and returns could become less momentum-driven and more dependent on earnings delivery, valuation discipline and sector rotation. We maintain a pro-risk stance, but as of the end of June we trimmed slightly our overweight recommendation of stocks relative to bonds.
The bottom line: AI remains a durable investment theme, but the next phase of the market may reward balance more than concentration. We believe investors should stay invested, stay diversified, and consider using periods of volatility to help ensure portfolios are positioned not just for the market leaders of the first half, but also for the broader opportunities that may emerge in the second half, while staying aligned with their investment goals and comfort with risk.
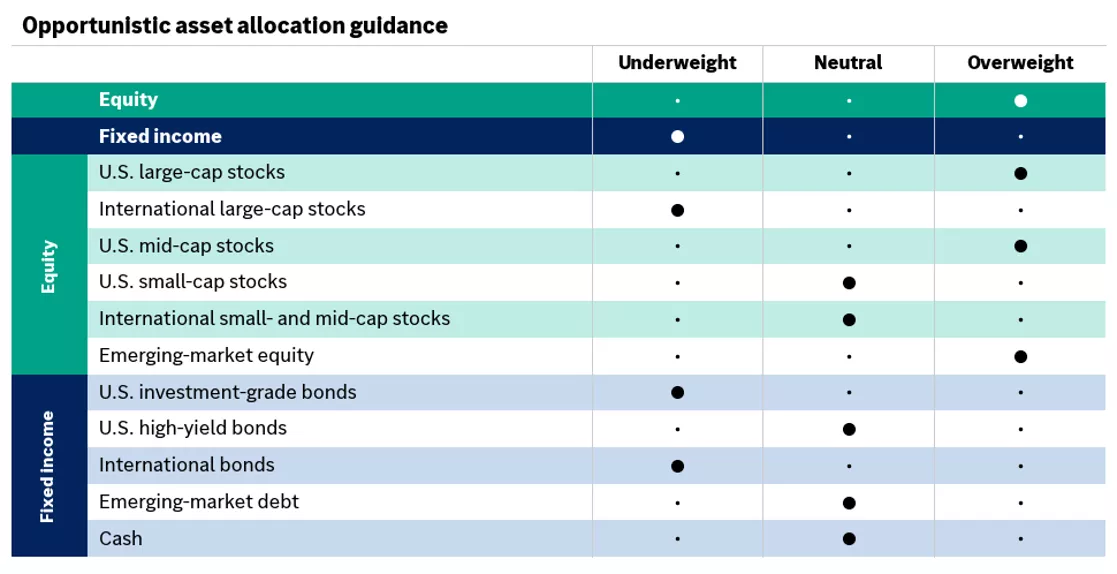
The table shows the Edward Jones opportunistic asset allocation guidance.
Our opportunistic asset allocation guidance follows:
Equity — overweight overall; overweight for U.S. large-cap stocks, U.S. mid-cap stocks and emerging-market equity; neutral for U.S. small-cap stocks and international small- and mid-cap stocks; underweight for international large-cap stocks.
Fixed income — underweight overall; neutral for U.S. high-yield bonds, emerging-market debt and cash; underweight for U.S. investment-grade bonds and international bonds.
Our opportunistic portfolio guidance represents our timely investment advice based on current market conditions and a shorter-term outlook. We believe incorporating this guidance into a well-diversified portfolio may enhance your potential for greater returns without taking on unintentional risks, helping keep your portfolio aligned with your risk and return objectives.
Angelo Kourkafas, CFA
Senior Global Investment Strategist
Source for all data in commentary: Bloomberg, FactSet
Angelo Kourkafas
Angelo Kourkafas is responsible for analyzing market conditions, assessing economic trends and developing portfolio strategies and recommendations that help investors work toward their long-term financial goals.
He is a contributor to Edward Jones Market Insights and has been featured in The Wall Street Journal, CNBC, FORTUNE magazine, Marketwatch, U.S. News & World Report, The Observer and the Financial Post.
Angelo graduated magna cum laude with a bachelor’s degree in business administration from Athens University of Economics and Business in Greece and received an MBA with concentrations in finance and investments from Minnesota State University.
Previous weeks' weekly market wraps


Important Information:
The Weekly Market Update is published every Friday, after market close.
This is for informational purposes only and should not be interpreted as specific investment advice. Investors should make investment decisions based on their unique investment objectives and financial situation. While the information is believed to be accurate, it is not guaranteed and is subject to change without notice.
Investors should understand the risks involved in owning investments, including interest rate risk, credit risk and market risk. The value of investments fluctuates and investors can lose some or all of their principal.
Past performance does not guarantee future results.
Market indexes are unmanaged and cannot be invested into directly and are not meant to depict an actual investment.
Diversification does not guarantee a profit or protect against loss in declining markets.
Systematic investing does not guarantee a profit or protect against loss. Investors should consider their willingness to keep investing when share prices are declining.
Dividends may be increased, decreased or eliminated at any time without notice.
Special risks are inherent in international investing, including those related to currency fluctuations and foreign political and economic events.
Before investing in bonds, you should understand the risks involved, including credit risk and market risk. Bond investments are also subject to interest rate risk such that when interest rates rise, the prices of bonds can decrease, and the investor can lose principal value if the investment is sold prior to maturity.