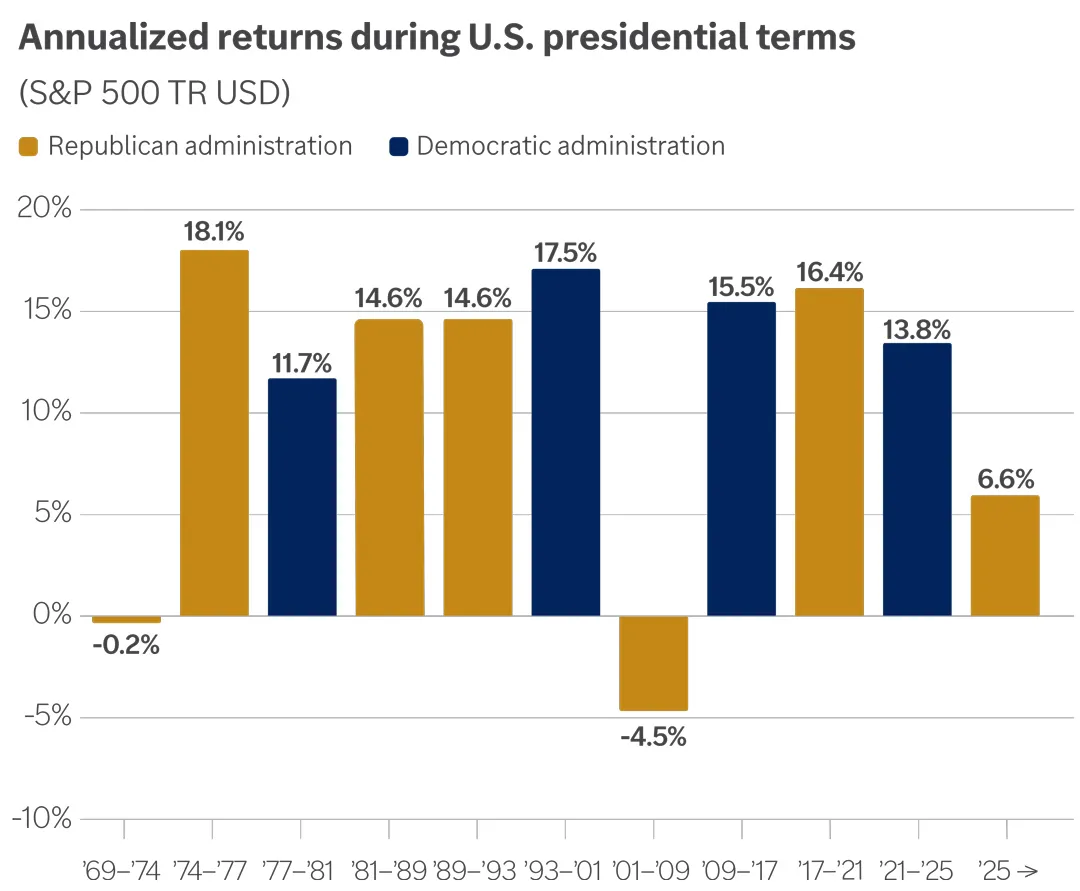
This chart shows that, going back to 1969, annualized returns for the S&P 500 have been mostly positive during U.S. presidential terms regardless of party.
This chart shows that, going back to 1969, annualized returns for the S&P 500 have been mostly positive during U.S. presidential terms regardless of party.
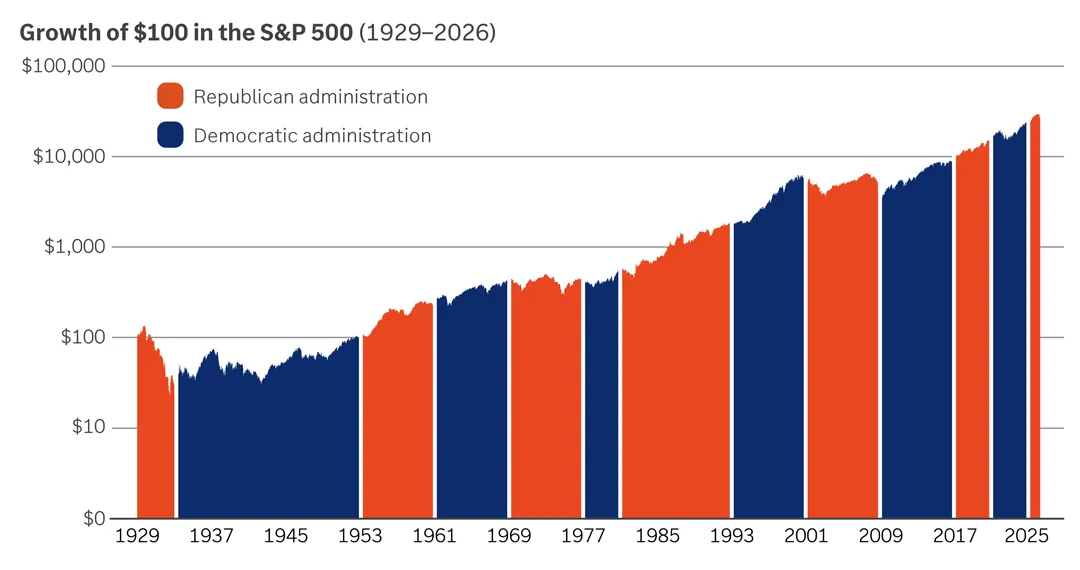
This chart shows the path of a $100 investment in the S&P 500 from 1929 onward with Republican and Democratic administrations highlighted. Keep in mind that you cannot invest directly into the S&P 500.
This chart shows the path of a $100 investment in the S&P 500 from 1929 onward with Republican and Democratic administrations highlighted. Keep in mind that you cannot invest directly into the S&P 500.
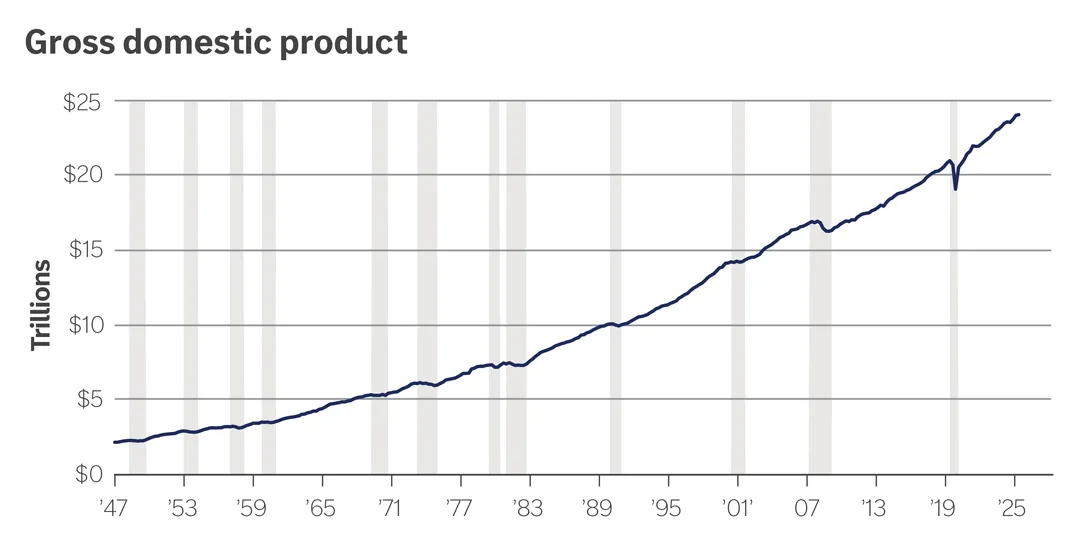
This chart shows the path of U.S. real gross domestic product, or real GDP, since 1947.
This chart shows the path of U.S. real gross domestic product, or real GDP, since 1947.
*Source: FactSet. S&P 500 Total Return Index, 1/1/1970–12/31/2024. The S&P 500 is an unmanaged index, cannot be invested in directly and is not meant to depict an actual investment. Past performance is not a guarantee of future results.
Diversification does not guarantee a profit or protect against loss in a declining market.
Investors should understand the risks involved in owning investments, including interest rate risk, credit risk and market risk. The value of investments fluctuates, and investors can lose some or all of their principal.