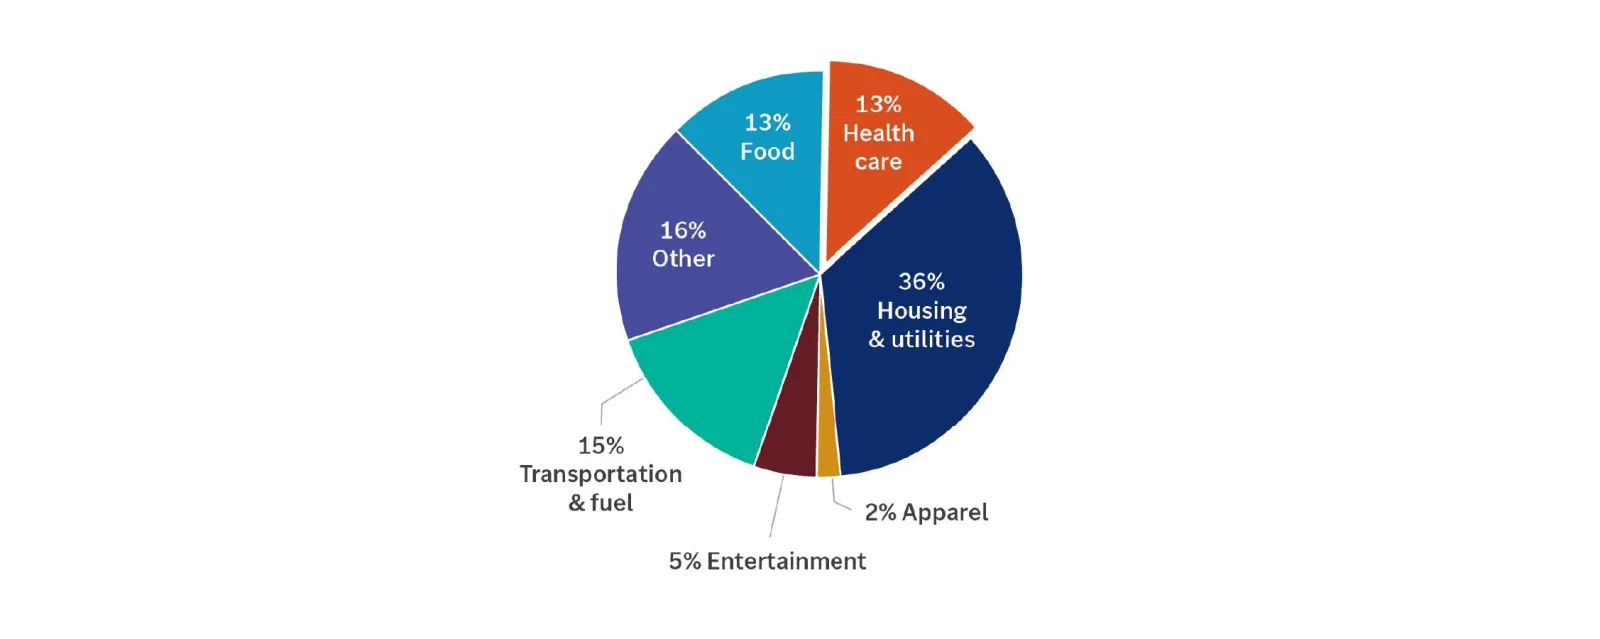
This pie chart shows the average expenditures for a household ages 65 and older: 13% of expenses go to health care, 13% to food, 36% to housing and utilities, 2% to apparel, 5% to entertainment, 15% to transportation and fuel, and 16% to other.
This pie chart shows the average expenditures for a household ages 65 and older: 13% of expenses go to health care, 13% to food, 36% to housing and utilities, 2% to apparel, 5% to entertainment, 15% to transportation and fuel, and 16% to other.
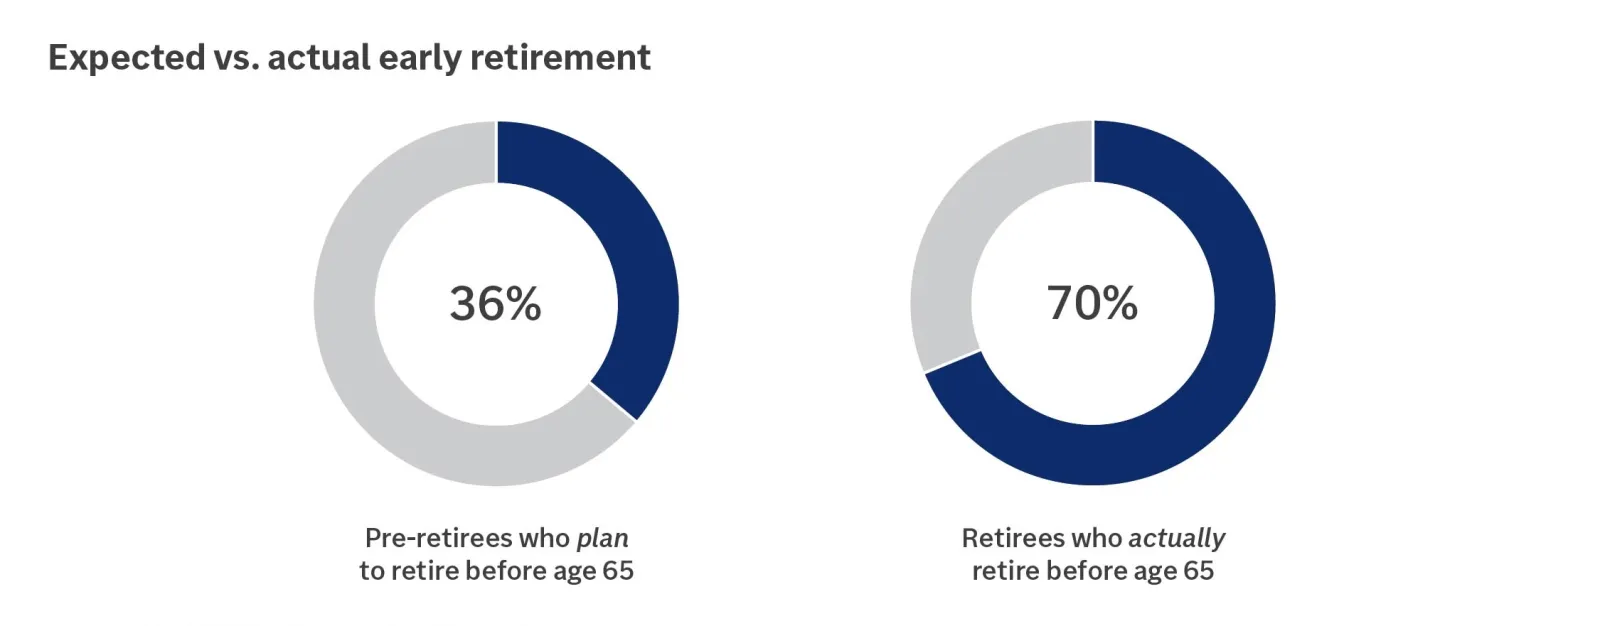
This chart shows only 36% of pre-retirees plan to retire before age 65, but 70% of retirees actually retire before age 65.
This chart shows only 36% of pre-retirees plan to retire before age 65, but 70% of retirees actually retire before age 65.
Important information:
This content is meant as educational only and is not intended for other than broadly informational purposes. The information has been prepared from sources and data we believe to be reliable, but we make no guarantee to its accuracy or completeness.