International stocks confront geopolitical risk and emerging opportunity
International equities began the year with strong momentum, but the escalation of conflict in the Middle East has introduced uncertainty and paused their outperformance relative to U.S. stocks. The duration and severity of the conflict will be a critical determinant of how meaningful the resulting energy supply shock becomes. While volatility is likely to remain elevated in the near term, we believe international equities can reassert their value once energy prices begin to normalize.
Energy dependence is a vulnerability
The conflict poses downside risks to global growth and upside risks to inflation through higher energy prices. As a net energy exporter since 2019, the U.S. is better insulated from rising energy costs. By contrast, many international economies face greater exposure due to their reliance on imports. For example, Japan imports roughly 90% of its energy needs, while much of Asia and the euro area depend heavily on energy flows through the Strait of Hormuz. Sustained higher energy prices would pressure household incomes and growth abroad. Ultimately, the length of any supply disruption will determine the market impact. A short-lived spike in oil prices would likely allow international equities to resume outperformance, whereas a prolonged conflict would be a more meaningful headwind. Encouragingly, recent developments point toward de‑escalation, potentially allowing international equities to reassert leadership.
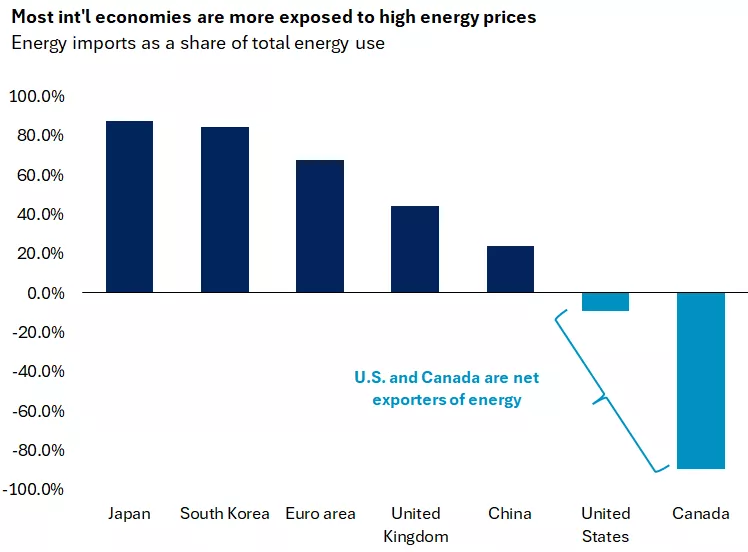
This chart shows energy imports as a share of total energy use for Japan, South Korea, Euro area, United Kingdom, China, U.S. and Canada. The U.S. and Canada are net energy exporters, while the other countries are more reliant on energy imports.
This chart shows energy imports as a share of total energy use for Japan, South Korea, Euro area, United Kingdom, China, U.S. and Canada. The U.S. and Canada are net energy exporters, while the other countries are more reliant on energy imports.
Central banks are sensitive to inflation risks
Higher oil prices are also prompting a reassessment of interest-rate expectations globally, with short-term rates moving higher since the conflict began. Central banks that are closer to neutral and primarily focused on inflation—rather than operating under a dual mandate like the Federal Reserve—may be less inclined to look past an energy-driven inflation shock. Reflecting this dynamic, European Central Bank rhetoric has turned more hawkish, and markets are increasingly pricing in one to two rate hikes this year in both the euro area and the UK.
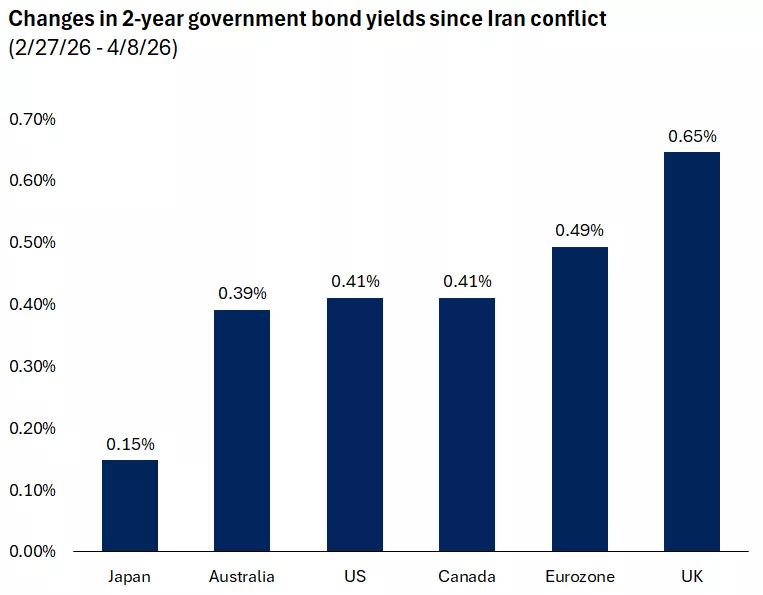
This chart shows the change in percentage points of 2-year government bond yields for Japan, Australia, the U.S., Canada, the euro zone, and the United Kingdom. Yields have risen across the globe since the start of the conflict in Iran.
This chart shows the change in percentage points of 2-year government bond yields for Japan, Australia, the U.S., Canada, the euro zone, and the United Kingdom. Yields have risen across the globe since the start of the conflict in Iran.
U.S. dollar re-emerges as safe haven, but downtrend may resume
Last year, a sharply weaker U.S. dollar provided a tailwind to international equity returns. Since the onset of the Iran conflict, however, the dollar has strengthened, reclaiming its role as a safe-haven asset amid heightened geopolitical uncertainty. As long as energy prices remain elevated, the dollar is likely to stay supported. That said, tighter policy expectations abroad should help limit the extent of dollar appreciation and if the reported ceasefire holds, the dollar softness may resume.
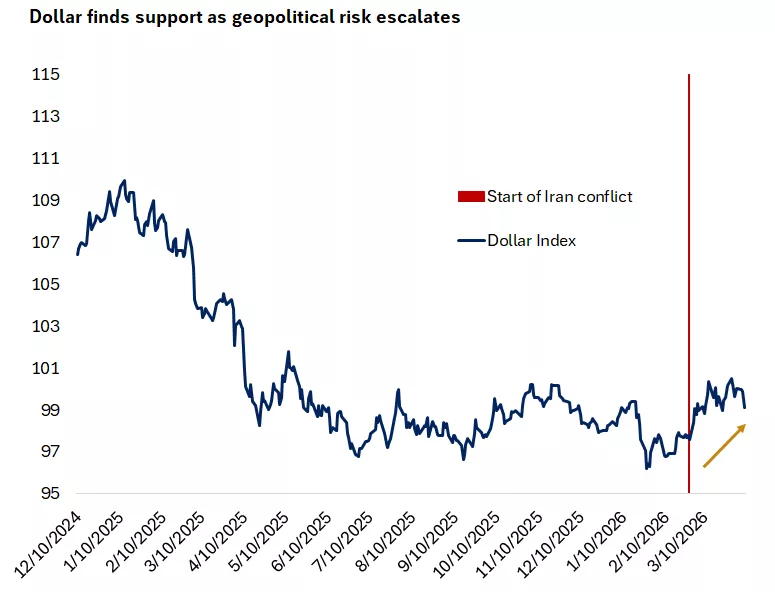
The chart shows that the DXY U.S. dollar index has risen since the start of the conflict in Iran.
The chart shows that the DXY U.S. dollar index has risen since the start of the conflict in Iran.
Opportunities amid heightened volatility
We continue to favor emerging-market equities and international developed small- and mid-caps over large-cap international equities. The recent pullback linked to geopolitical concerns may present an opportunity for investors to add to international exposure if allocations are below long-term strategic targets.
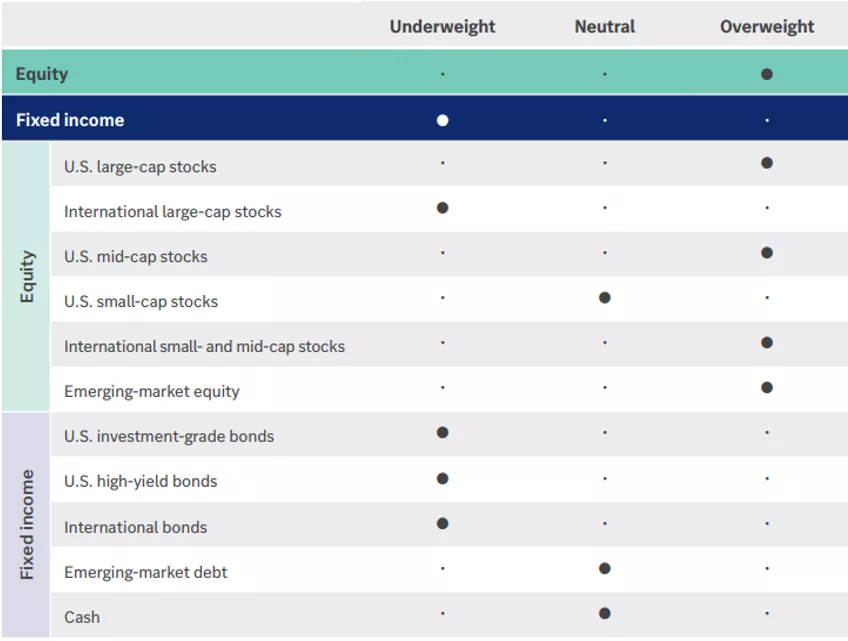
Our opportunistic asset allocation guidance follows:
Equity — overweight overall; overweight for U.S. large-cap stocks, U.S. mid-cap stocks, international small- and mid-cap stocks and emerging-market equity; neutral for U.S. small-cap stocks; underweight for international large-cap stocks.
Fixed income — underweight overall; neutral for emerging-market debt and cash; underweight for U.S. investment-grade bonds, U.S. high-yield bonds and international bonds.
Angelo Kourkafas, CFA;
Senior Global Investment Strategist
Source for all data: Bloomberg
Angelo Kourkafas
Angelo Kourkafas is responsible for analyzing market conditions, assessing economic trends and developing portfolio strategies and recommendations that help investors work toward their long-term financial goals.
He is a contributor to Edward Jones Market Insights and has been featured in The Wall Street Journal, CNBC, FORTUNE magazine, Marketwatch, U.S. News & World Report, The Observer and the Financial Post.
Angelo graduated magna cum laude with a bachelor’s degree in business administration from Athens University of Economics and Business in Greece and received an MBA with concentrations in finance and investments from Minnesota State University.
Important information:
This report is intended as informational only and should not be interpreted as specific recommendations or investment advice. Investors should make investment decisions based on their unique investment objectives and financial situation. Opinions stated are as of the date of this report and subject to change.
Investing in equities involves the risk of loss. The value of an investors shares can fluctuate, and investors can lose money. Small-and mid-cap stocks tend to be more volatile than large company stocks. Special risks are inherent in international investing, including those related to currency fluctuations and foreign political and economic events.
Diversification does not guarantee a profit or protect against loss in declining markets.