


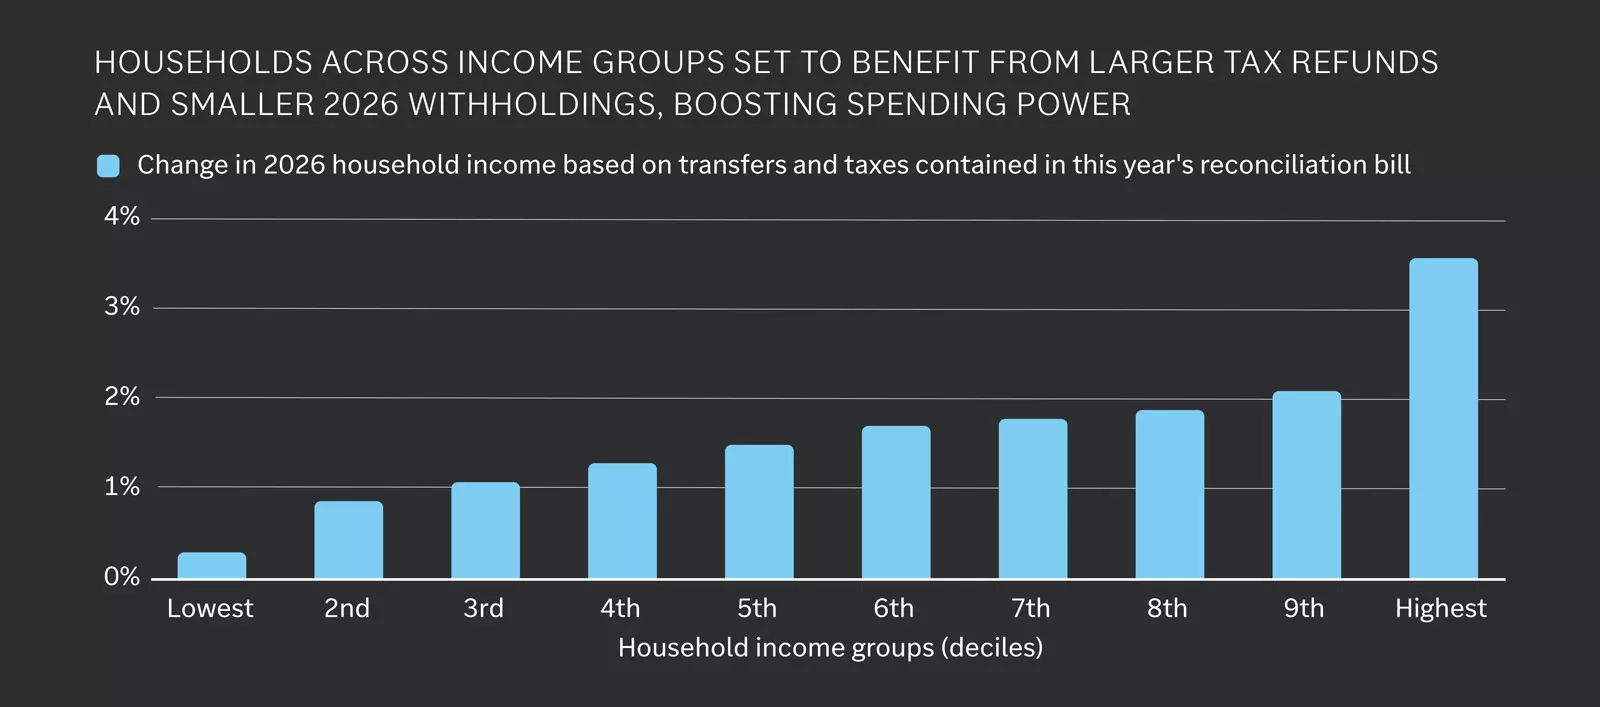
The chart is titled “Households Set to Benefit from Larger Tax Refunds and Smaller 2026 Withholdings, Boosting Spending Power.” It is a vertical bar chart with household income groups (deciles) on the X-axis, from Lowest to Highest, and percentage change in 2026 household income on the Y-axis, ranging from 0% to 4%. Each bar represents projected income changes based on transfers and taxes in the reconciliation bill. The lowest income group shows a small increase near 0.3%. Middle-income groups (2nd to 9th deciles) gradually rise from about 1% to 2%. The highest income group has the largest increase, close to 3.5%. Overall, higher-income households benefit more than lower-income households.
The chart is titled “Households Set to Benefit from Larger Tax Refunds and Smaller 2026 Withholdings, Boosting Spending Power.” It is a vertical bar chart with household income groups (deciles) on the X-axis, from Lowest to Highest, and percentage change in 2026 household income on the Y-axis, ranging from 0% to 4%. Each bar represents projected income changes based on transfers and taxes in the reconciliation bill. The lowest income group shows a small increase near 0.3%. Middle-income groups (2nd to 9th deciles) gradually rise from about 1% to 2%. The highest income group has the largest increase, close to 3.5%. Overall, higher-income households benefit more than lower-income households.
The U.S. economy had lots to contend with in 2025: upheavals in trade policy, a slowing labor market and a record-breaking government shutdown. Despite these disruptions, growth looks set to come in around 2%, representing healthy activity rates. We expect this solid, Goldilocks-esque GDP growth to continue through 2026, in what should hopefully be a smoother ride.
There are a few reasons for this optimism.
First, we should see the benefits of tax cuts passed earlier this year show up in larger refunds next spring, modestly boosting household spending power. Businesses will also benefit from this legislation, with a more favorable tax treatment of investment likely to encourage capex and R&D.
Second, the Fed is expected to continue to take its foot off the policy brakes, lowering interest rates from levels that present a drag on the economy toward more neutral settings. We expect this easing will lessen the burden of existing debt and encourage new investment and spending in the economy.
Third, regulatory policy changes are likely to gain traction next year. Leadership changes across a range of government agencies are expected to deliver looser guidelines around energy, banking and competition policy, potentially reviving animal spirits.
Fourth, the AI investment boom looks set to continue, helping to lift spending across a range of digital technologies, data centers and power infrastructure as the rapid adoption of this burgeoning technology increases electricity demand.
Finally, the noise around trade policy should quiet in 2026. Certainly, the uncertainty this year has weighed on business sentiment, and seemingly hiring too. More stability around tariffs and trade relationships should lessen this apprehension.
Tempering our optimism is the ongoing slowdown in U.S. labor force growth, which creates something of a speed limit on the economy. An aging population, low rates of immigration and higher deportations could all weigh on growth, particularly in sectors sensitive to labor shortages.
Still, another year of 2% GDP growth would present a solid backdrop for markets, especially if it comes absent the big swings in sentiment seen this year.
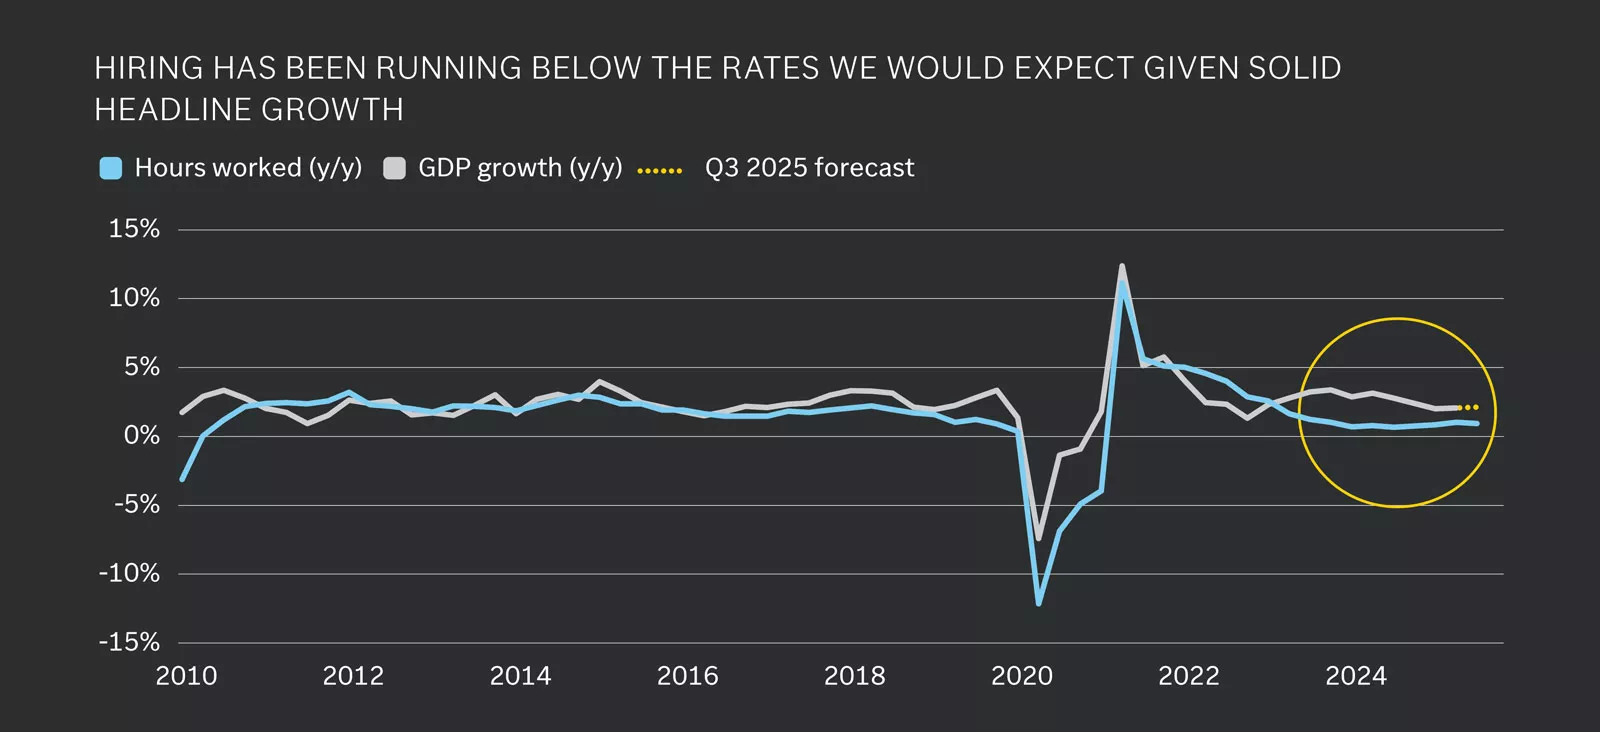
This chart shows the trends in GDP growth and hours worked. The growth rates of these have aligned closely over the past 15 years, but more recently we have seen GDP growth clearly outpace hours worked.
This chart shows the trends in GDP growth and hours worked. The growth rates of these have aligned closely over the past 15 years, but more recently we have seen GDP growth clearly outpace hours worked.
Two forces have shaped the labor market in 2025 and we believe will continue to do so through 2026.
The first is a precipitous slowdown in labor force growth due to an aging population, a sharp decline in net immigration and more Americans choosing not to work. Dallas Fed research finds that the number of newcomers into the labor market each month has plummeted from 200,000 – 250,000 in 2023 to 30,000 this year.
Second, firms are reluctant to hire. New job openings have fallen, business survey data indicates subdued hiring intentions and consumer surveys corroborate this caution, with more households reporting that it is harder to find work right now.
A reluctance to hire new staff likely reflects some of the uncertainty faced by businesses this year, although there is some evidence that AI is also starting to impact these trends too. Analysis of 2025 labor data points to around 1 in every 20 layoffs being attributed to AI, reflecting some early signs of labor market disruptions from this new technology.
Fewer workers and fewer jobs have put the labor market in the slow lane, with nonfarm payroll gains slowing to just 60,000 per month over the past six months. Meanwhile, unemployment rates have risen, even if these remain low from a historic standpoint.
Slow labor force growth looks very likely to persist into 2026, especially given the administration’s continued focus on immigration. There is some risk that this starts to trigger labor shortages in sectors that lean on immigrant workers, such as construction and agriculture.
Meanwhile, businesses should remain cautious around hiring as we move into 2026, but this might moderate through the year. Current hiring rates are running below those consistent with solid headline growth. If activity remains steady, as we expect, firms may need to bring in new staff to meet this demand.
Therefore, we should see the labor market stabilize as we move through 2026, with unemployment expected to trend around 4.5% next year. This stabilization should help alleviate concerns over the health of the economy, but the labor market will remain very much in the slow lane, with monthly payroll prints to remain in the 50,000 – 100,000 range.
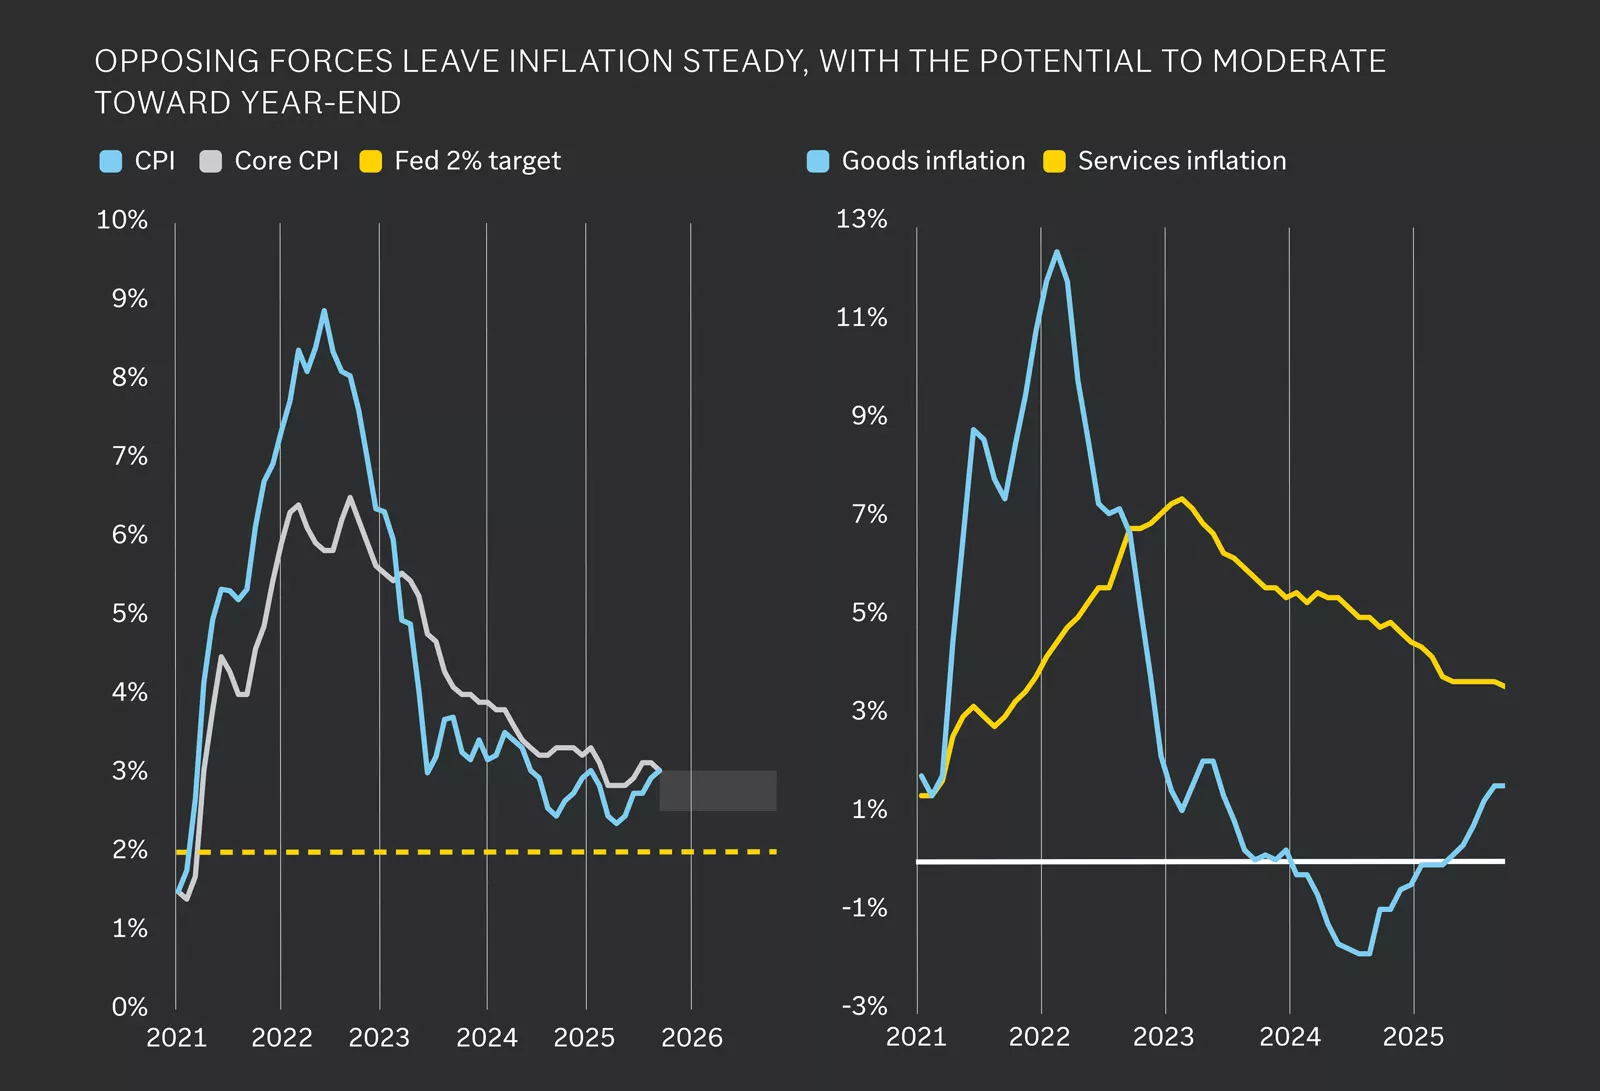
Inflation pressures peaked in 2022, driven by goods and services, but remain above the Fed’s 2% target through 2025 despite significant declines.
Inflation pressures peaked in 2022, driven by goods and services, but remain above the Fed’s 2% target through 2025 despite significant declines.
We expect inflation to remain above the Fed’s target through 2026, supported by stable economic growth and lingering price pressures. However, we do not anticipate a major reacceleration, with headline inflation likely holding in the 2.5% – 3.0% range and showing modest improvement by year-end compared to 2025.
Tariffs have contributed to a pickup in goods prices, a trend likely to persist early in the year before fading by mid-2026. Absent another major trade escalation, we see tariffs as a one-off increase and a temporary driver of inflation.
Services inflation, which accounts for 75% of the core CPI basket, remains sticky but on a gradual path of moderation. A slowdown in home prices and rents suggests further downside in shelter inflation. Beyond housing, services inflation is heavily influenced by the labor market. While softening conditions — rising unemployment, fewer job openings and slower quits — should keep wage growth muted, structural constraints, such as lower immigration and an aging population, may keep wages above pre-pandemic levels. Longer term, productivity gains from AI could act as a disinflationary force, though this may simply offset pressures from high government spending and deglobalization.
Bottom line: Mixed pressures leave inflation steady — still above target, yet no worse than last year.
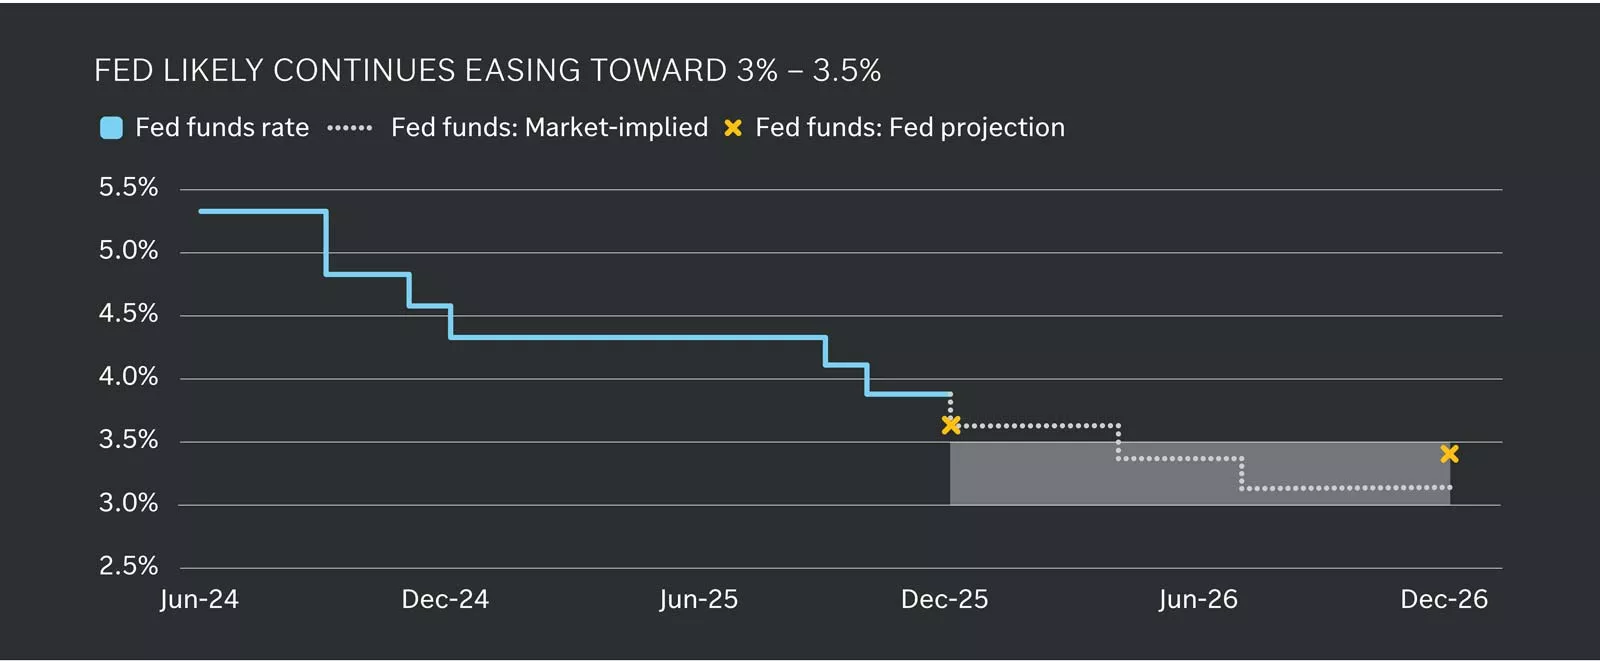
Chart titled “Fed Likely Continues Easing Toward 3%–3.5%.” Line shows Fed funds rate declining from about 5.5% in mid-2024 to near 3% by late 2026, with market-implied and Fed projections indicated. Chart description: The Federal Reserve is expected to continue lowering interest rates over the next two years, moving from restrictive levels above 5% toward a neutral range near 3%.
Chart titled “Fed Likely Continues Easing Toward 3%–3.5%.” Line shows Fed funds rate declining from about 5.5% in mid-2024 to near 3% by late 2026, with market-implied and Fed projections indicated. Chart description: The Federal Reserve is expected to continue lowering interest rates over the next two years, moving from restrictive levels above 5% toward a neutral range near 3%.
With CPI inflation likely slowing toward 2.5% – 3.0%, we see the Fed continuing its rate-cutting cycle in 2026. Importantly, this easing is driven by a cooling labor market and moderating inflation rather than an economic downturn. However, ongoing economic resilience and inflation remaining above target suggest the Fed easing cycle may be shallow from here.
In 2025, the Fed concluded its balance sheet reduction program, known as quantitative tightening. This step should help enhance liquidity by stabilizing bank reserves — deposits by banks at the Fed, widely regarded as among the highest-quality and most liquid assets in the banking system. We anticipate the Fed will resume expanding its balance sheet in 2026 to ensure adequate reserves, providing additional monetary support and serving as another form of policy easing.
The Fed’s preferred inflation gauge — core personal consumption expenditure (PCE) — typically runs slightly below CPI inflation, partly because it assigns a smaller weight to shelter, where prices have risen at a faster pace historically. PCE also accounts for changes in consumer behavior more quickly, such as substitution toward cheaper goods and services as prices rise. Consequently, core PCA could drift closer to 2.5% next year, and a neutral Fed policy rate is generally considered to be around 0.75% - 1% above inflation for the U.S.
While not our base case, upside risks to this outlook include the possibility that lingering inflation becomes entrenched or even accelerates — potentially spurred by tariffs feeding through to goods prices or higher wages pressuring services inflation — which could slow the pace of rate cuts. Conversely, a sharper labor-market slowdown could prompt the Fed to move more aggressively.
Overall, we expect cash yields to fall further toward the low 3% range as rate cuts progress. Some investors remain overweight in cash-like investments, including money market funds, which attracted significant inflows in recent years due to elevated yields. Cash offers important benefits, such as funds for unexpected expenses, short-term savings goals and everyday spending. However, holding too much can pose the risk of lower long-term returns. After evaluating how much cash you need, consider reinvesting excess cash into asset classes that may be underweight relative to your intended allocations to better align your portfolio with your financial goals.
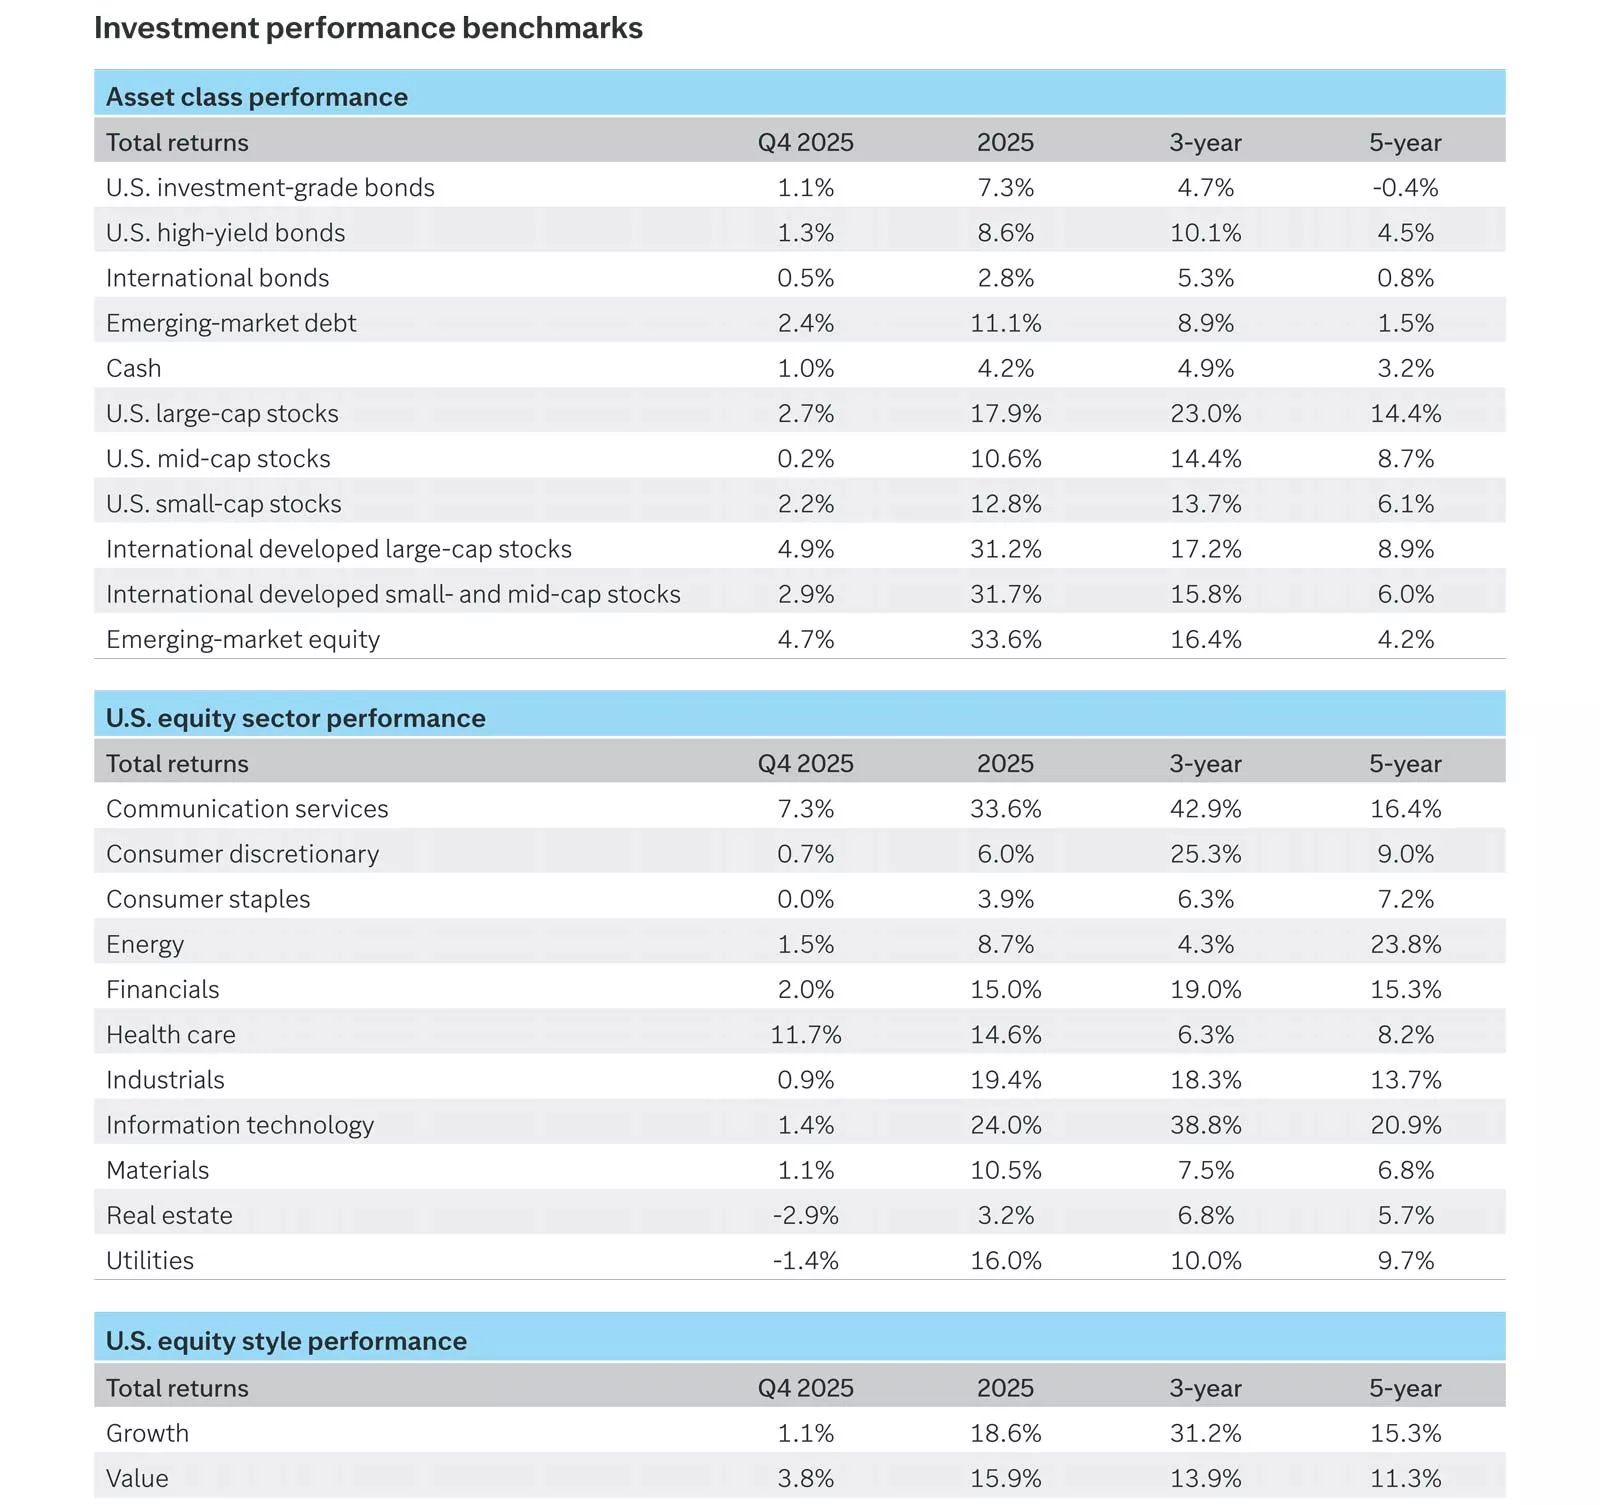
In 2025, U.S. equity markets were led once again by technology and AI sectors. This marked the third year in a row that growth outperformed value, and sectors such as technology and communication services dominated the S&P 500 sector returns. And this growth leadership emerged despite the volatility we saw early in April 2025, when tariff uncertainty wreaked havoc on tech sectors.
The reason for the outperformance was relatively straightforward: Mega-cap technology firms delivered substantial upside to earnings growth in 2025 and reaffirmed strong outlooks for 2026. The key question for investors now is whether tech and AI can lead markets for a fourth year.
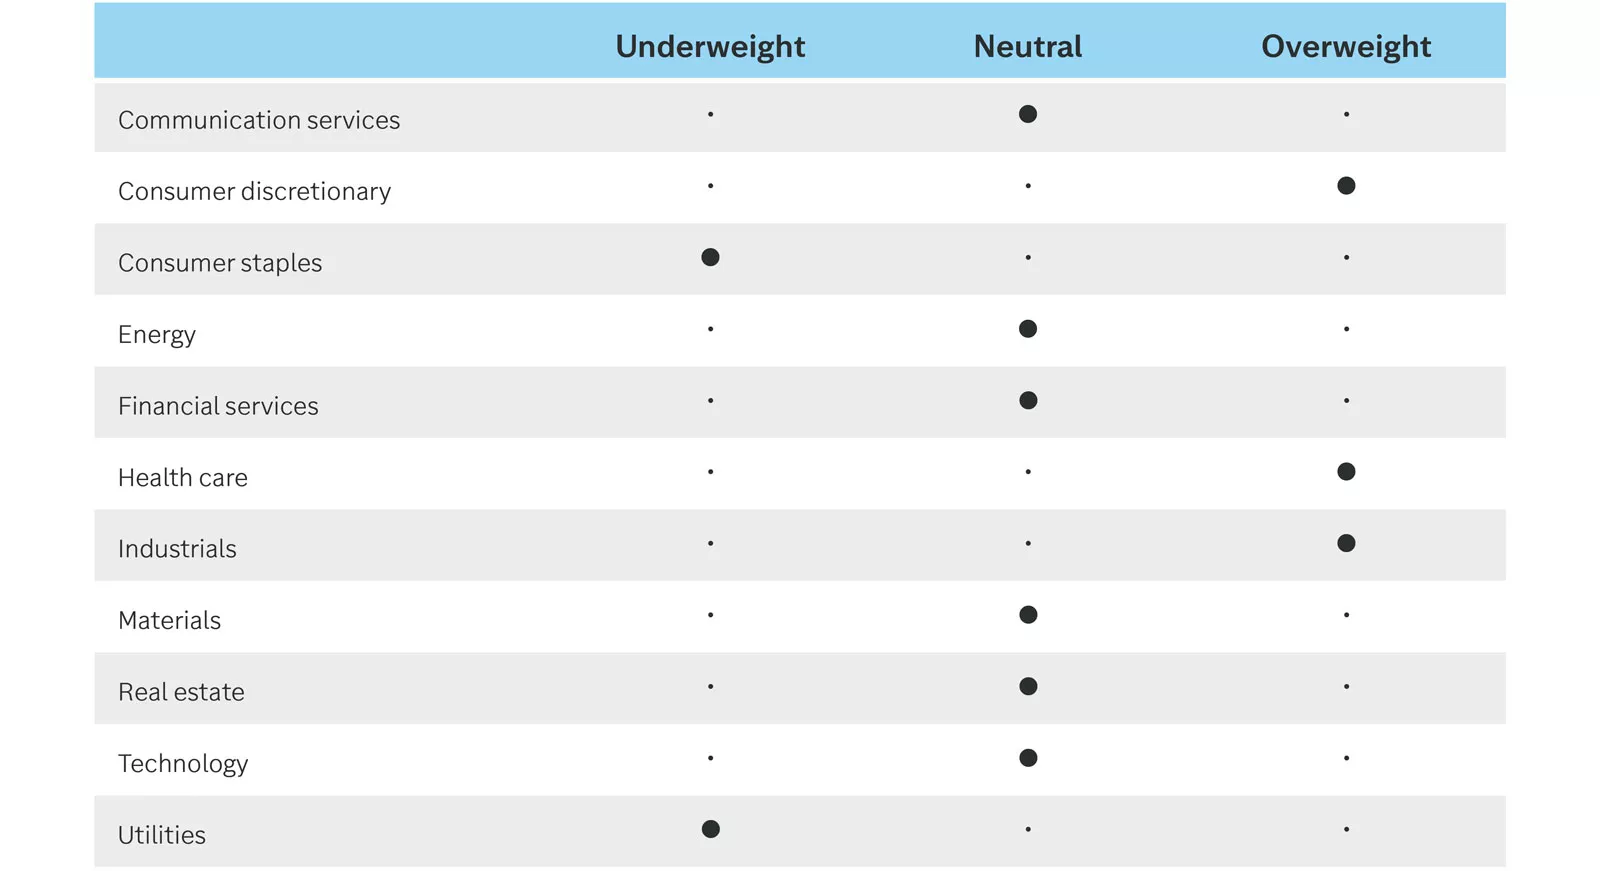
In our view, the answer lies largely in the earnings outlook for 2026. While technology and growth sectors substantially outpaced the rest of the market in terms of earnings growth in 2025, the year ahead may look different. Both tech and non-tech parts of the market are expected to deliver solid earnings, with forecasts pointing to positive earnings growth across all 11 S&P 500 sectors in 2026. In addition to technology and communication services, sectors such as financials, industrials and consumer discretionary are all expected to produce double-digit earnings growth.
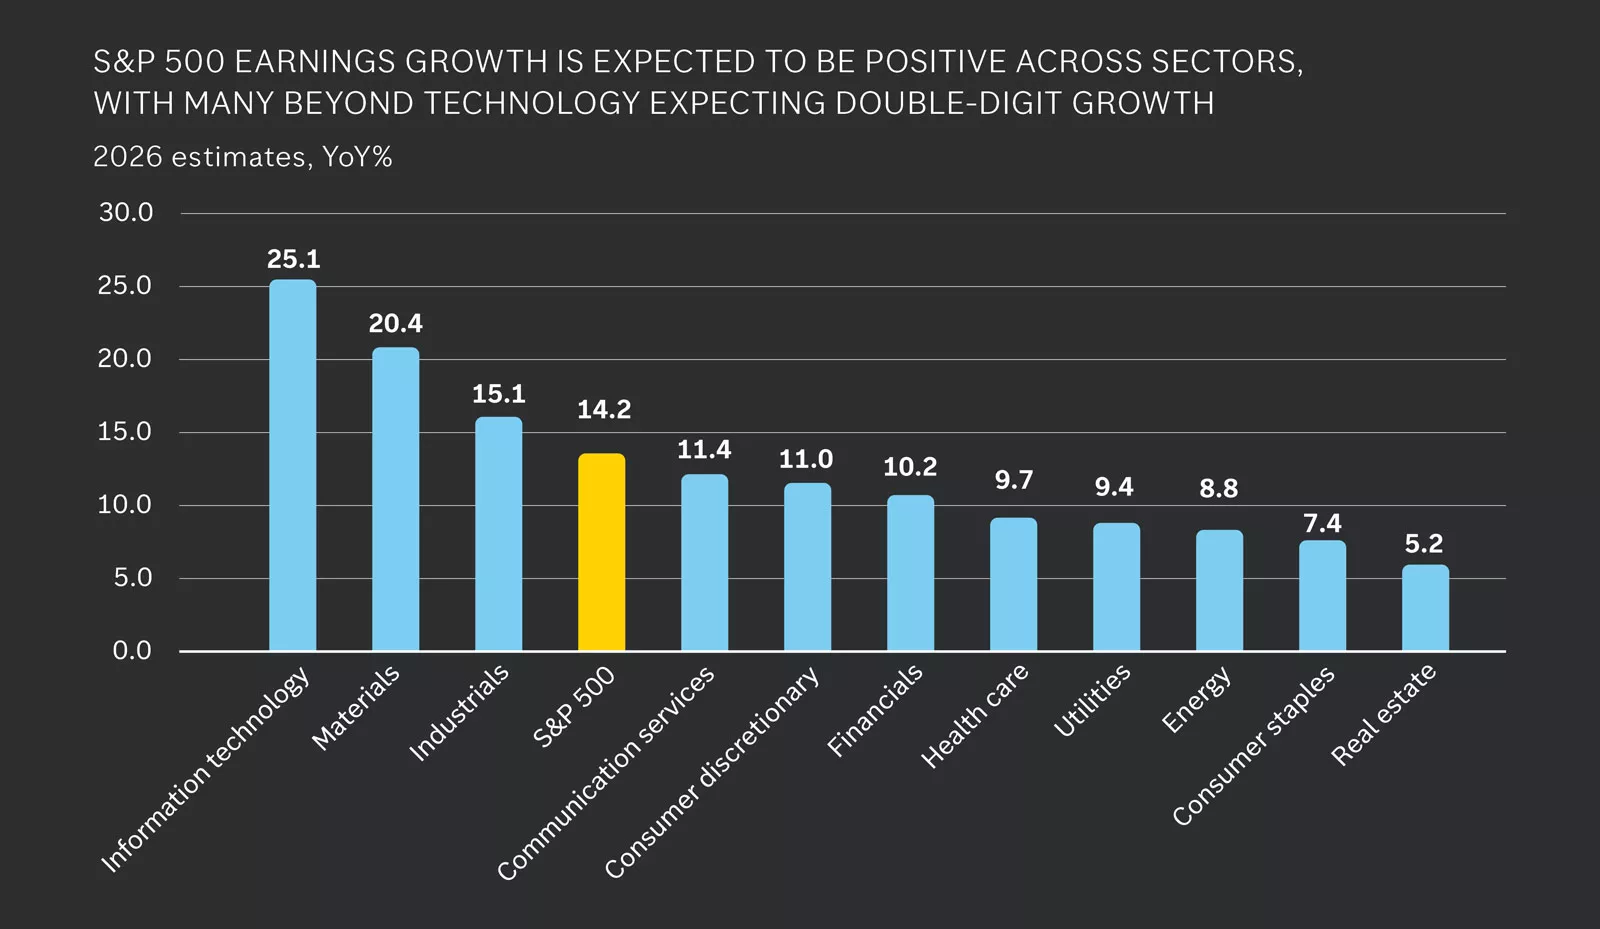
All sectors show positive growth expectations for 2026, with Information Technology and Materials leading at over 20%, while Real Estate lags at just above 5%. The overall S&P 500 estimate is 14.2%, indicating broad-based earnings strength.
All sectors show positive growth expectations for 2026, with Information Technology and Materials leading at over 20%, while Real Estate lags at just above 5%. The overall S&P 500 estimate is 14.2%, indicating broad-based earnings strength.
There are also some business model shifts worth monitoring in the mega-cap technology firms. While the growth rates and backlogs of these companies are still stellar, the pace of growth is coming down — and this second derivative may matter more in the year ahead. We could also see clear winners and losers emerge in areas such as AI chatbots or semiconductor chips. And many of the mega-cap technology firms are now taking on debt to finance the tremendous AI capex spending while becoming more asset-heavy, all of which may weigh on margins and valuations over time.
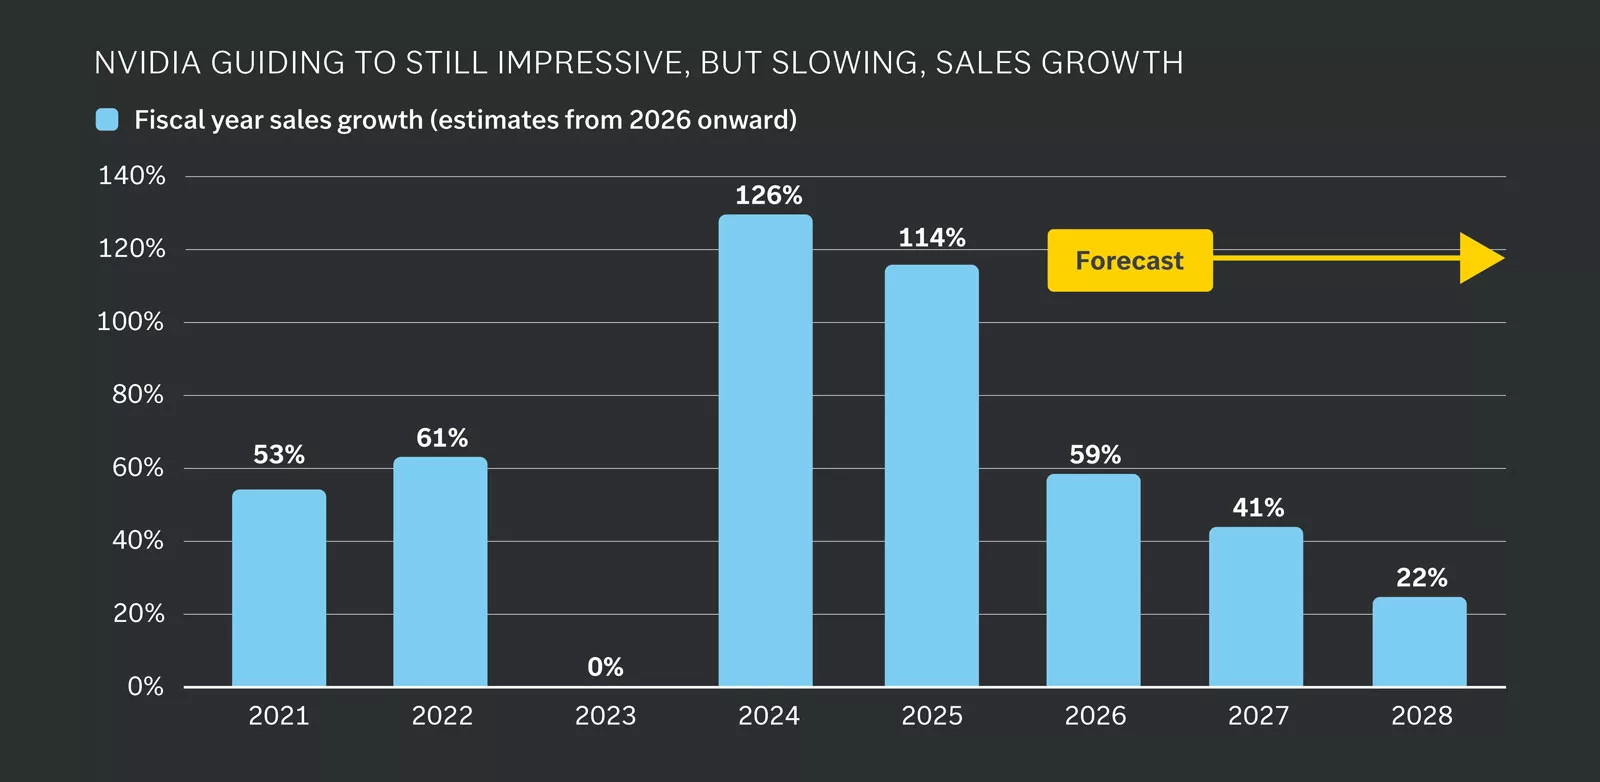
Annual sales growth surges in 2024 and 2025, then declines steadily through 2028.
Annual sales growth surges in 2024 and 2025, then declines steadily through 2028.
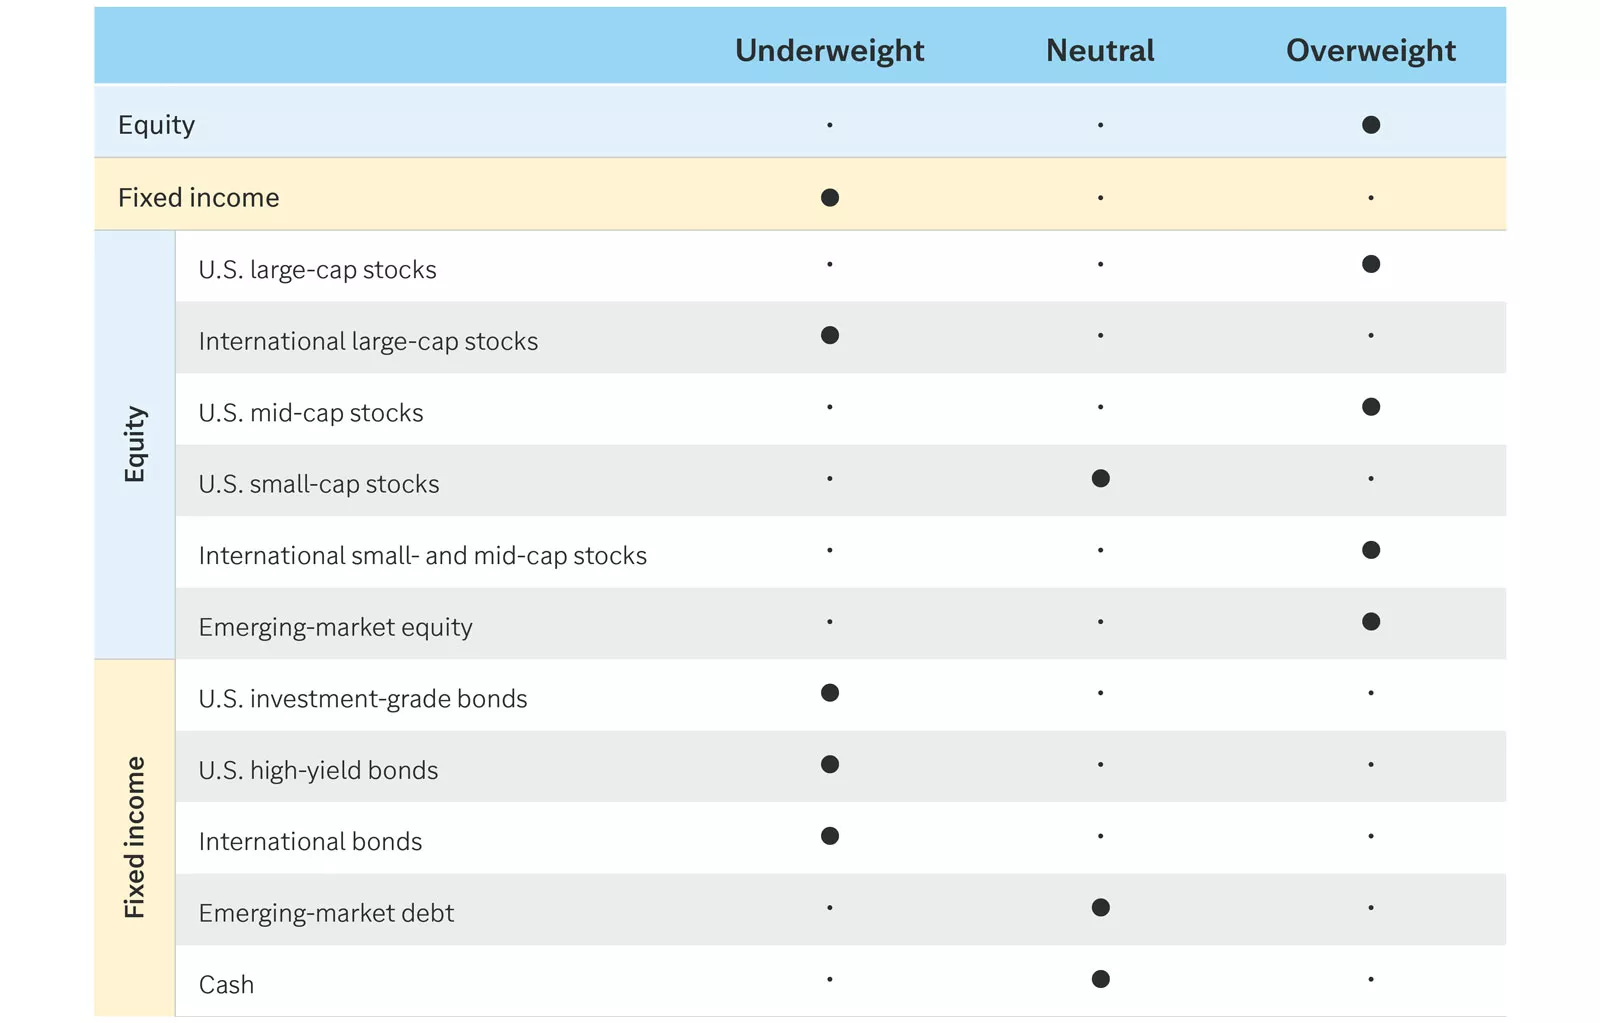
How do we think about portfolio positioning in this backdrop?
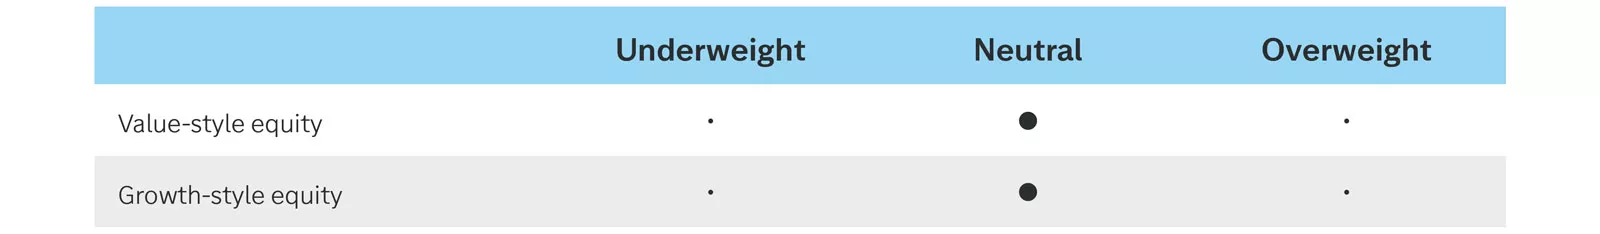
In our view, given where we are in this cycle, the case for diversification in equity markets is more compelling in 2026. We favor U.S. large-cap stocks, which are exposed to the AI theme, alongside U.S. mid-cap stocks, which are more weighted toward cyclical sectors and have scope for catch-up, especially as the Federal Reserve potentially lowers interest rates. We also recommend looking globally, in emerging-market equities, which can do well when the Fed cuts rates and offer exposure to a global technology theme, as well as international small- and mid-cap stocks, which have relatively favorable valuations. Finally, we remain equal weight on growth and value, as we think value and cyclical-style equities can perform well alongside tech and AI baskets in the year ahead.
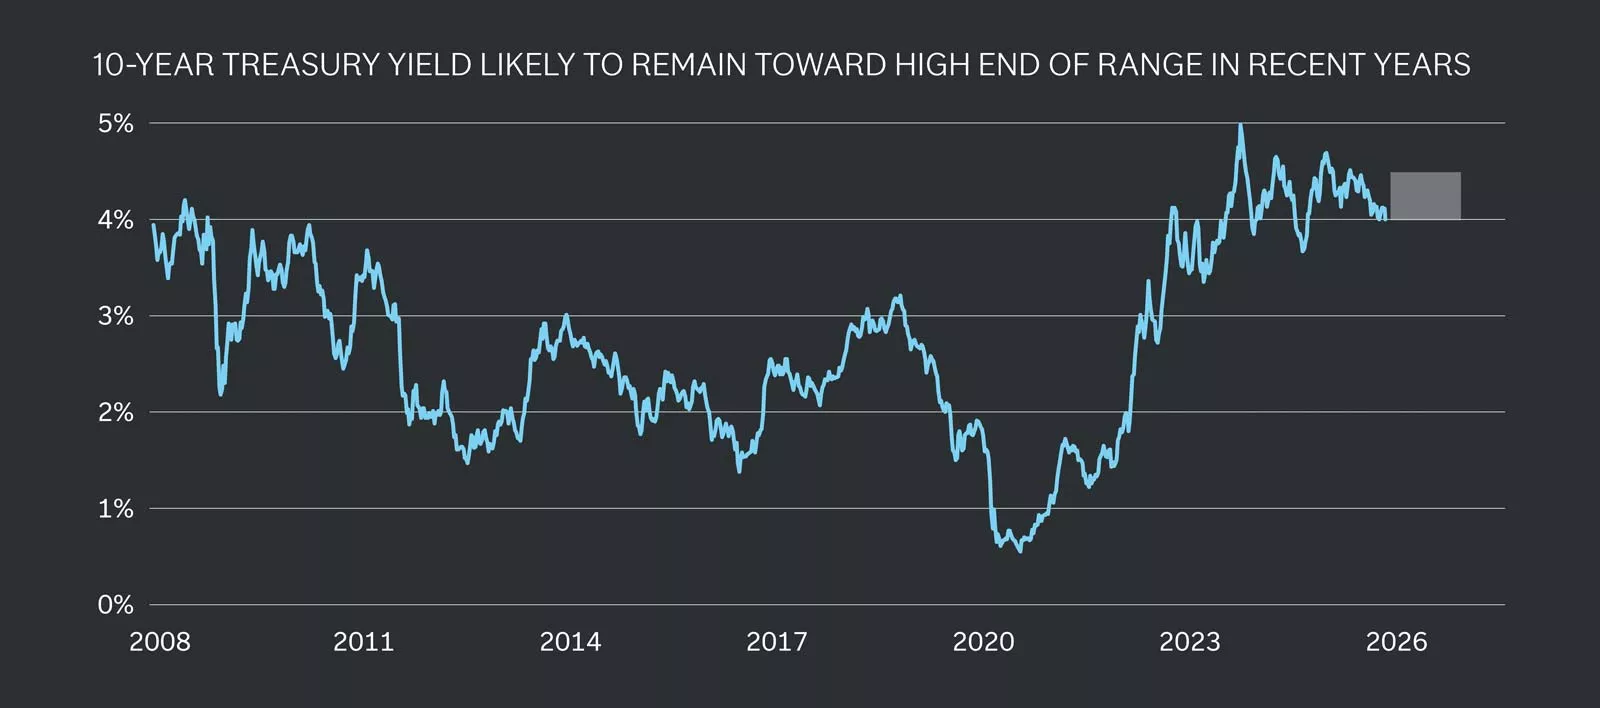
Yields have rebounded from historic lows and are expected to stay elevated near 4%.
Yields have rebounded from historic lows and are expected to stay elevated near 4%.
With the federal funds rate likely heading toward 3% – 3.5%, a positive yield curve should keep intermediate-term bond yields above this range. We expect the benchmark 10-year Treasury yield to remain largely within within the 4.0% – 4.5% range in 2026.
We believe there are some guardrails in place around this level. Although 10-year yields may temporarily overshoot, we would expect them to drift back toward 4.0% - 4.5%. Additional Fed purchases of Treasury bills should help anchor the short end of the yield curve near the federal funds rate, likely limiting upside pressure on yields. Conversely, resilient economic growth, persistent budget deficits and inflation risks typically drive yields higher, making a sustained drop unlikely, in our view.
Despite pulling back from recent peaks, 10-year yields remain attractive — near the high end of their range since 2008, shown in the chart above. Higher yields mean that bonds generate more income. Since Treasury bonds serve as the benchmark for most U.S. investment-grade bonds, elevated yields should provide a foundation for solid returns ahead, with most of the contribution coming from income rather than price appreciation.
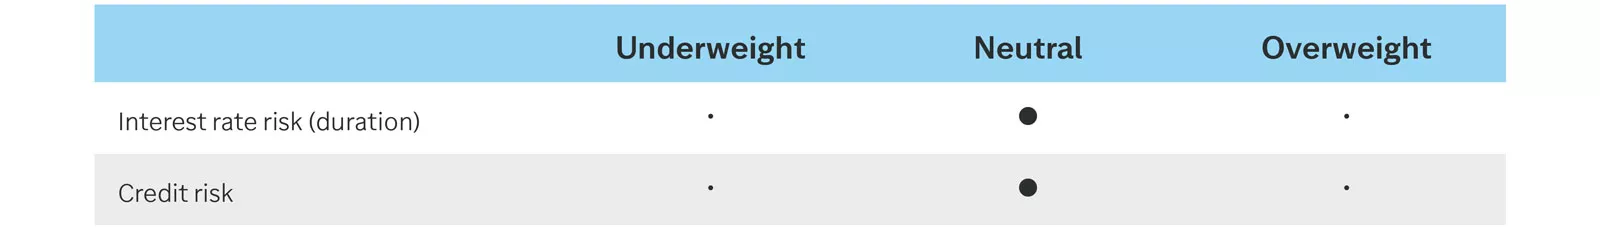
On the credit side, credit spreads — the excess yield above Treasury bonds to compensate for default risk — have tightened well below historical averages. We see little room for further narrowing, and any potential widening could drive yields higher and bond prices lower. Resilient growth could provide a stable backdrop for credit conditions, allowing investment-grade credit spreads to remain relatively contained. High-yield bond spreads may be more susceptible to widening, as they are closer to historical lows and tend to be more sensitive to any weakening in credit conditions.
Further Fed rate cuts could widen the yield advantage of bonds over cash. Since yield is a key driver of fixed-income returns, this sets the stage for bonds to outperform cash again in 2026, as they have in 32 of the past 45 years. For perspective, since 1981, U.S. investment-grade bonds have generated annualized returns of 6.1%, compared with 4.1% for cash.
For investors in higher income tax brackets, municipal bonds (muni bonds) can offer attractive after-tax income, particularly when held in taxable accounts. This is because interest on muni bonds is typically exempt from federal income tax, and muni bonds issued in your state may also be exempt from state and local taxes. Tax-exempt muni bonds can be compared to taxable bonds using the tax-equivalent yield, calculated as: tax-exempt yield ÷ (1 – marginal federal income tax rate). This represents the yield on a fully taxable bond that would provide the same after-tax income as a tax-exempt muni bond. As shown in the following chart, muni bonds may generate higher after-tax income than comparable taxable bonds.
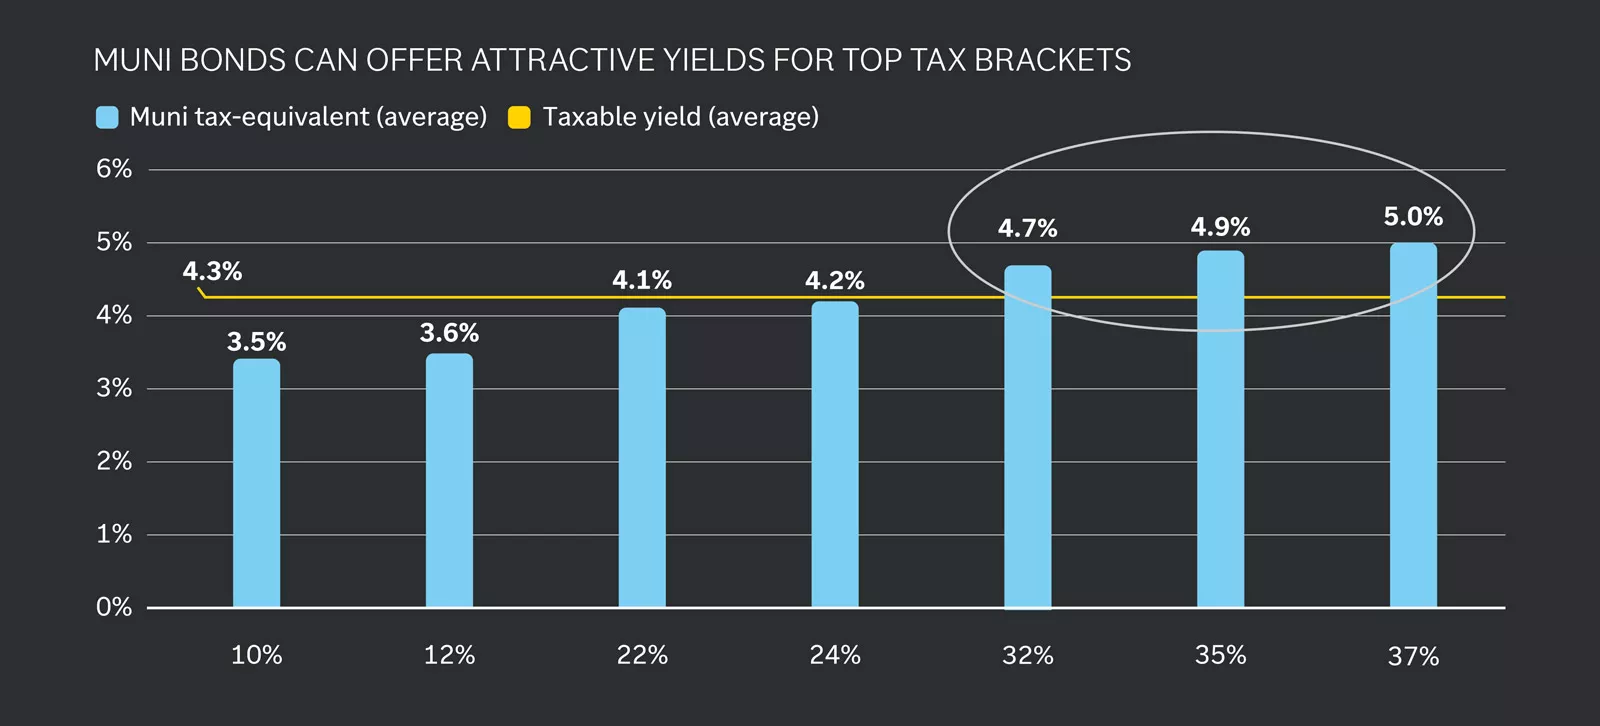
Muni bonds outperform taxable yields for higher tax brackets, offering up to 5.02%.
Muni bonds outperform taxable yields for higher tax brackets, offering up to 5.02%.
2025 was a strong year for international equities, with markets in Germany, France, the United Kingdom and Japan all reaching new all-time highs.¹ We anticipate that 2026 will be another favorable year for global economies and markets, underscoring the importance of international diversification. While the robust performance of 2025 may be challenging to replicate, we believe there are compelling reasons to remain optimistic about international stocks in 2026.
Eurozone economies are beginning to benefit from the European Central Bank’s rate-cutting cycle, as evidenced by rising loan demand and improving business activity surveys.¹ Furthermore, fiscal stimulus measures announced by Germany in the spring are expected to bolster economic activity in the eurozone’s largest economy throughout 2026. With the sharp rally in European equities during 2025 largely valuation-driven, we see potential for earnings growth to play a more prominent role in supporting equity markets this year.
In the United Kingdom, persistently high inflation has prompted a cautious approach to monetary easing by the Bank of England (BoE). However, with signs of labor market softening, the BoE may have room to continue easing policy in 2026, potentially supporting economic activity. Similar to the eurozone, the U.K. economy has shown signs of strengthening loan demand, and survey-based indicators of business activity have improved.1
Turning to Japan, despite demographic headwinds and U.S. auto tariffs, economic activity remained resilient in 2025 and could be further supported in 2026 by a pro-growth policy agenda under Japan’s new government.¹ Notably, corporate governance reforms implemented over the past decade appear to be bearing fruit, with Japanese company profit margins reaching a 20-year high in 2025.²
Taken together, we believe international developed stocks merit an allocation within diversified portfolios. In our view, the combination of economic momentum in the eurozone, improving profitability among Japanese corporations, potential for accelerating earnings growth, and relatively attractive valuations — particularly among small- and mid-cap companies — supports the case for another year of positive returns in 2026. Additionally, with the S&P 500 heavily concentrated in the 10 largest companies, adding exposure to international developed markets can help manage risk, broaden opportunity sets and enhance long-term portfolio resilience.
Within emerging markets, economic activity in China has been subdued, with a battered property sector dampening consumer confidence and loan demand.1 Additionally, U.S. trade policy has contributed to sluggish manufacturing activity in the world’s second-largest economy, and trade tensions between the U.S. and China are likely to persist in 2026.
Nevertheless, we view emerging-market equities as a means of gaining exposure to the AI race at more attractive valuations versus the U.S. Additionally, emerging-market stocks have historically performed well in the periods following Federal Reserve interest rate cuts, which we believe creates a constructive backdrop for 2026.
1 Source: FactSet
2 Source: FactSet, LTM net profit margin MSCI Japan Index.
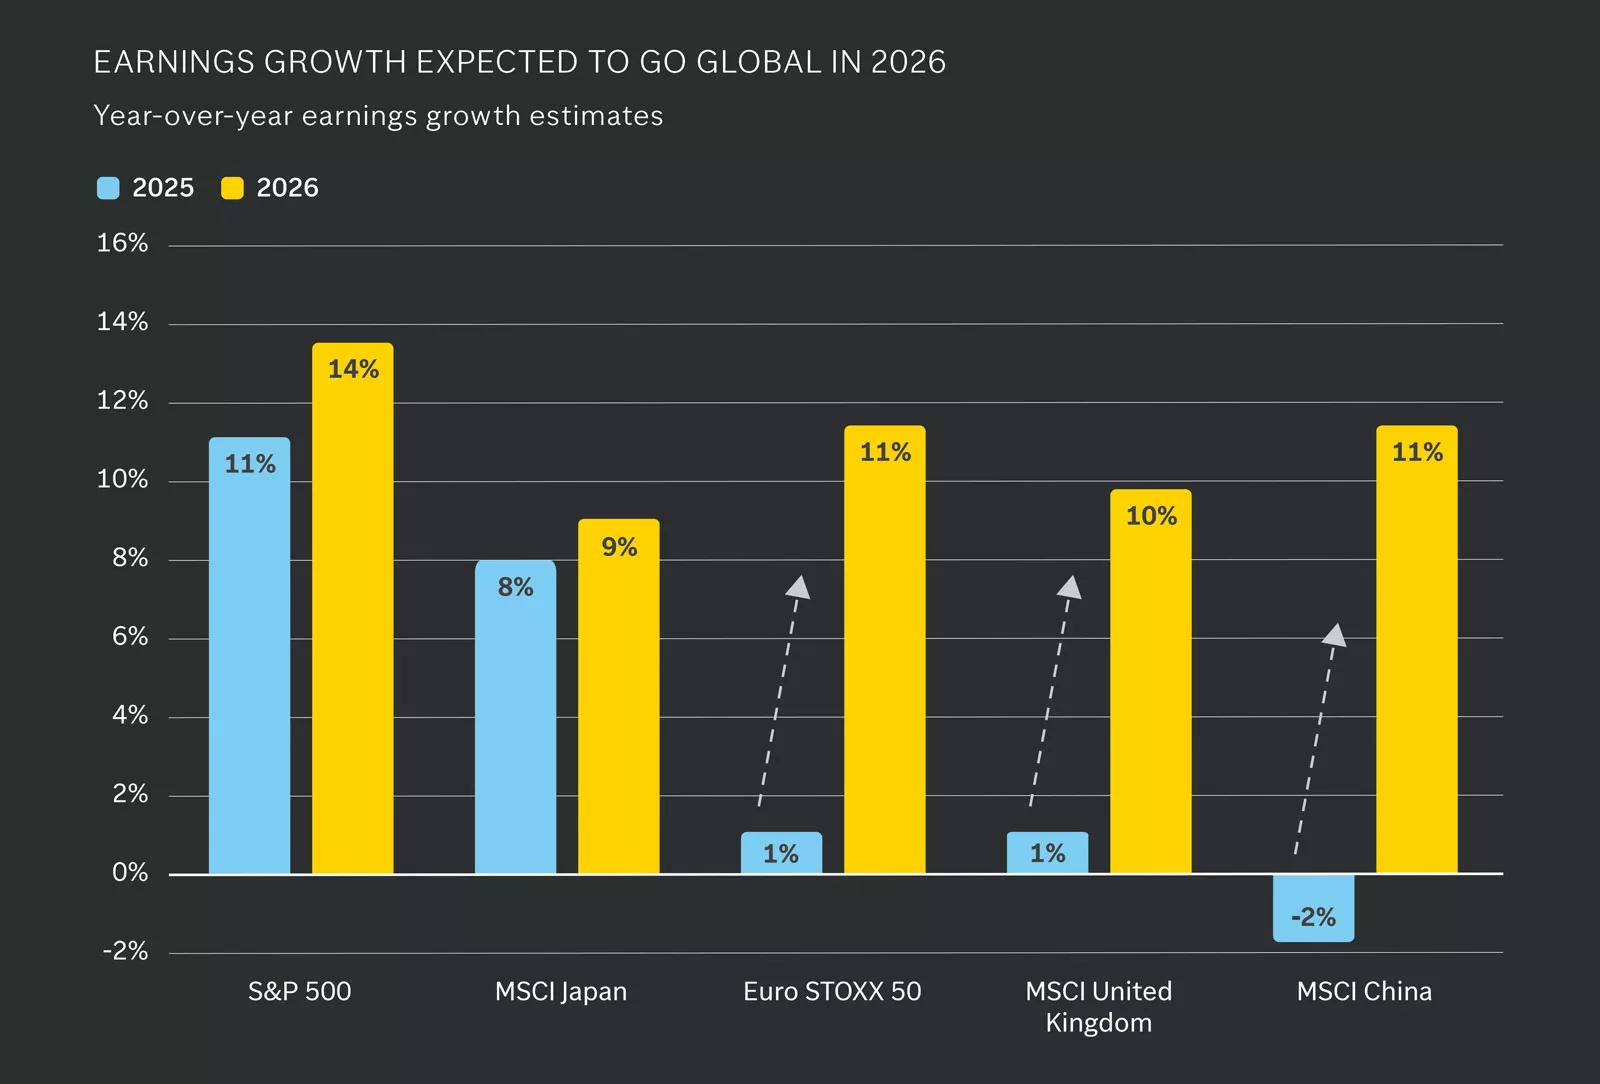
This chart shows earnings growth estimates for 2025 and 2026 for the S&P 500, MSCI Japan, Euro STOXX 50, MSCI U.K. and MSCI China Indices. Strong earnings growth across each of these regions is expected in 2026.
This chart shows earnings growth estimates for 2025 and 2026 for the S&P 500, MSCI Japan, Euro STOXX 50, MSCI U.K. and MSCI China Indices. Strong earnings growth across each of these regions is expected in 2026.
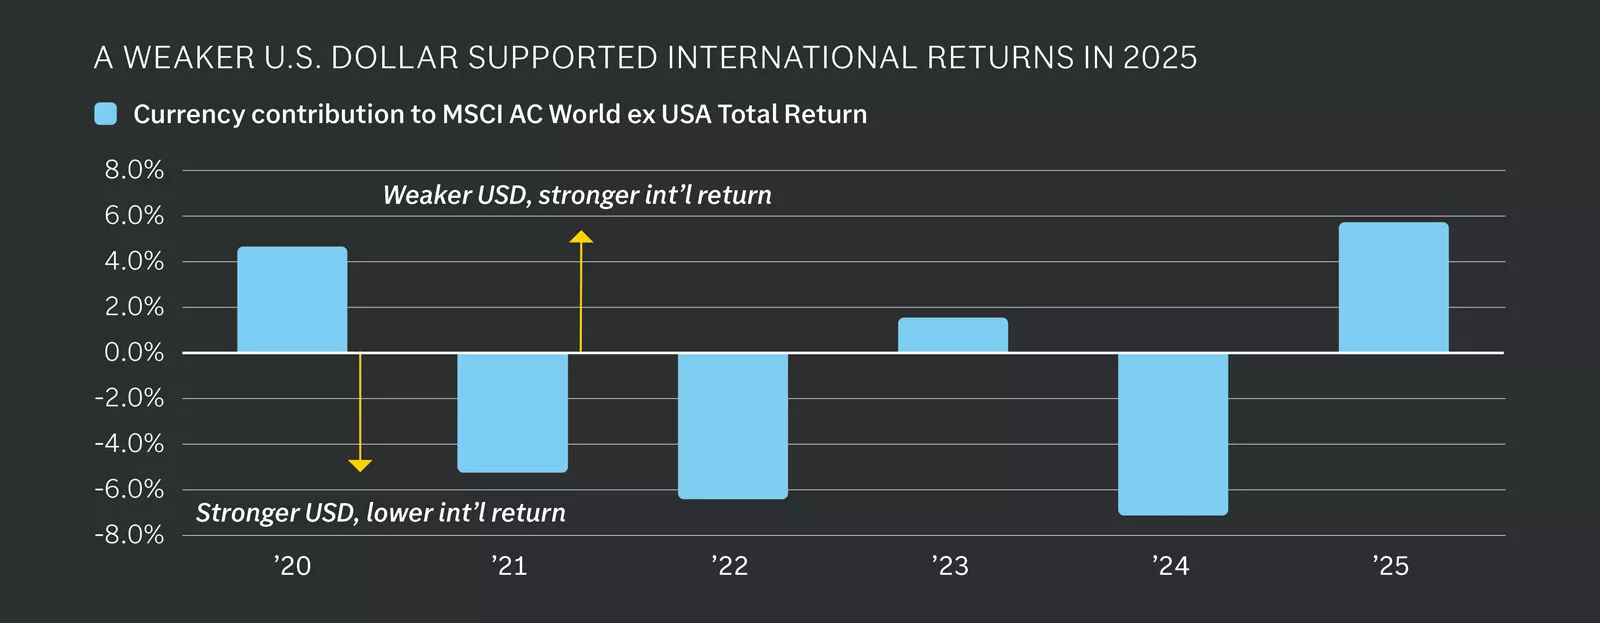
This chart shows the contribution of currency to the total return of the MSCI AC World ex USA Index. A weaker USD boosted international returns for U.S. investors in 2025.
This chart shows the contribution of currency to the total return of the MSCI AC World ex USA Index. A weaker USD boosted international returns for U.S. investors in 2025.
After a mostly uninterrupted 15-year bull market, the U.S. dollar came under pressure in 2025. Political and fiscal uncertainty, combined with a narrowing yield advantage versus other developed markets and increased currency hedging by foreign investors, contributed to the dollar’s decline. For investors, the weaker dollar provided meaningful support to international equity returns. However, the sharp fall early in the year reignited debate over whether the dollar is at risk of losing its status as the global reserve currency. In our view, the U.S. dollar’s central role in global trade and finance is unlikely to change in the foreseeable future. Nonetheless, we anticipate a flat-to-weaker dollar in 2026.
One way to assess global confidence in a currency is by examining its share of foreign exchange reserves — assets held by central banks in nondomestic currencies. In Q2 2025, the U.S. dollar accounted for 53.3% of global foreign exchange reserves, more than twice the share held in euros, the second-largest reserve currency.¹ Additionally, the dollar has remained the dominant currency for international payments, accounting for approximately 50% of global transactions in 2024, up from about 30% in 2012.² We believe the relative stability of the U.S. economy and its deep integration with global markets will support continued dollar dominance in the international financial system.
While we expect the dollar’s dominant role in global markets to persist, we see potential for a flat-to-weaker dollar in 2026. The U.S. yield advantage — across both short- and long-term maturities — has narrowed versus peers such as Japan and Germany.³ We anticipate further interest rate cuts by the Federal Reserve in 2026, while the European Central Bank appears to be at the end of its easing cycle and the Bank of Japan is expected to continue tightening into 2026.³ These divergent monetary policy paths could further erode the U.S. yield premium, placing modest downward pressure on the dollar.
For investors, currency effects are likely to play a less significant role in international returns in 2026 compared to the previous year. Nonetheless, with the U.S. yield advantage potentially diminishing and economic momentum improving in Europe, we maintain our outlook for a flat-to-weaker dollar in 2026 — reinforcing the case for maintaining a globally diversified portfolio.
1 Source: IMF Currency Composition of Official Foreign Exchange Reserves.
2 Source: Federal Reserve Board, “The International Role of the U.S. Dollar – 2025 Edition.”
3 Source: FactSet.
The Trump administration’s first year delivered the largest shakeup in tariff and trade policy in 100 years, a sizeable tax bill and a push to slash segments of the federal government. We expect 2026 to be quieter, but with the midterm elections in focus, we can’t rule out further fireworks.
One big question is whether Republicans use majorities in the House and Senate to pass another reconciliation bill, potentially to enact $2,000 tariff rebate checks for lower-and middle-income households. Given an already stretched deficit, we suspect lawmakers might balk at the $600 billion price tag of this giveaway, but further stimulus could be attractive in an election year.
On tariffs, the Supreme Court will rule whether the President overstepped his authority when using emergency powers to implement them. This decision may be less impactful than investors fear, as the President possesses a range of tools to raise tariffs should the emergency route be deemed unconstitutional.
More important will be any further shifts in tariff rates themselves. Following dramatic changes this year, we think rates will be more stable in 2026, with potential adjustments in bilateral tariffs, and for specific sectors, expected to drive only moderate adjustments in aggregate U.S. trade policy.
One important dynamic to watch will be the renegotiation of the USMCA trade agreement between the U.S., Canada and Mexico. This has shielded much of the trade across North America from higher tariff rates, and while grandstanding around the deal is to be expected, we think changes to the agreement will be modest.
Otherwise, policy changes started in 2025 will likely gain traction next year, with new leadership appointments across a range of government agencies to deliver more tangible deregulation. President Trump will also get the chance to appoint a new Fed chair, although we should be careful not to overstate the role this individual will play in setting policy as part of a 12-voting-member FOMC rate-setting committee.
It is too early to make any strong predictions over the midterm elections, although it is common to see incumbent parties struggle in these polls. Should Republicans lose one or both of their majorities in Congress, we could see political gridlock take hold in 2027 and 2028, reflecting the sparsity of bipartisan consensus in the current climate.
However, while everyone will have their view on politics, it is important to emphasize we would not recommend playing politics with your portfolio. Stock markets can perform well across a four-year presidential cycle regardless of the party in power, with important themes detached from political headlines — such as the AI revolution, corporate profitability and economic fundamentals — critical for markets. Moreover, while we have seen generally lower average returns during midterm years, these have typically been followed by more robust gains the following year.
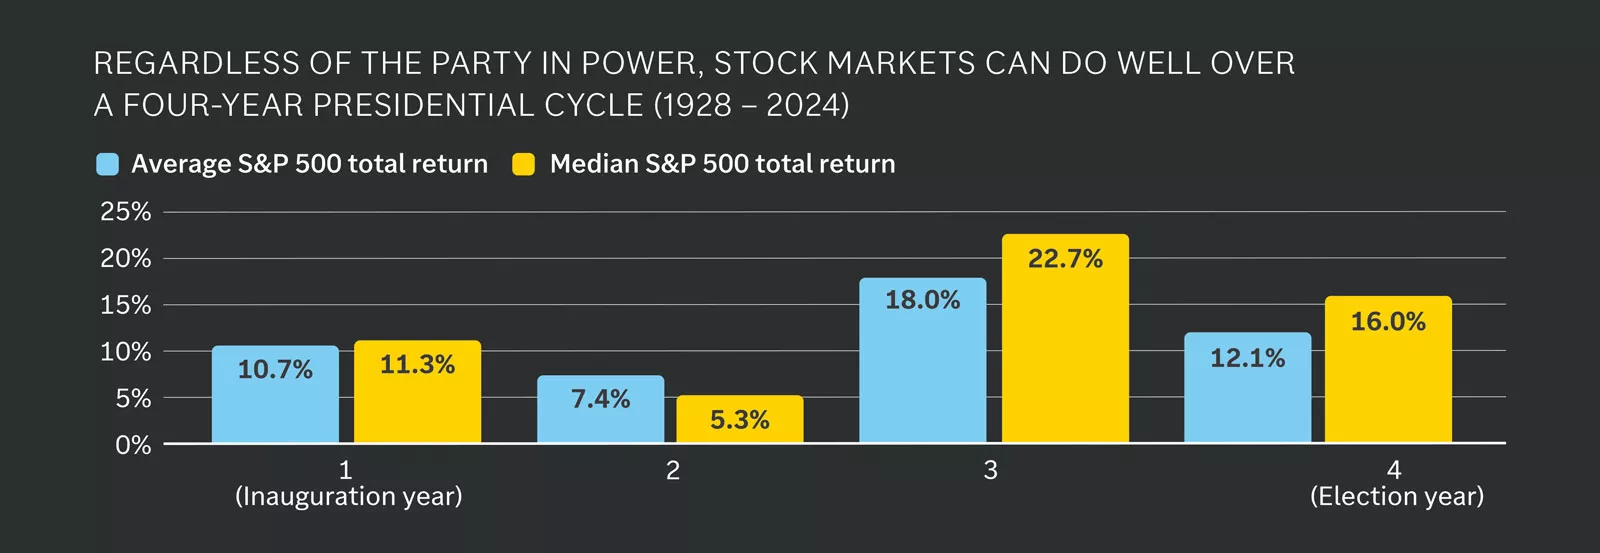
This chart shows the return of the S&P 500 index by year of the presidential election cycle.
This chart shows the return of the S&P 500 index by year of the presidential election cycle.
Our base case for 2026 calls for a relatively benign year: steady economic growth, modest fiscal stimulus, lower interest rates and rising corporate profits, all of which provide a supportive backdrop for financial markets. However, it is certainly worthwhile to highlight where our team sees the biggest tail risks and potentially disruptive forces for this scenario. The three biggest risks that could test market resilience in our view are AI disappointments, an inflation surprise and credit stress.
AI represents one of the most transformative technological advances in recent history and has already shaped market performance, with U.S. mega-cap technology stocks driving much of the bull market’s gains. Yet after a historic three-year rally, with the top 10 stocks now accounting for over 40% of the S&P 500’s market capitalization, questions are emerging about whether AI can deliver sufficient productivity and profit growth to justify heavy investment.
There are a few ways the mega-cap technology companies could disappoint investors. First, if AI adoption fails to meet expectations or the growth rates of these companies slow faster than forecast, optimism could fade, weighing on tech leadership and broader equity valuations. Second, a handful of winners could emerge across the AI space, which may put pressure on the secondary and tertiary players in the industry. Finally, as noted, many mega-cap technology companies are taking on debt to finance the large rise in AI capex spending, which could weigh on margins and stock multiples over time. In our view, maintaining exposure to innovation while avoiding overconcentration is critical in the year ahead.
A second risk to the outlook is an unexpected acceleration in inflation — beyond our base case of 2.5% – 3.0% headline CPI inflation — which would potentially halt the Fed’s rate-cutting cycle and put pressure on real wages. Inflation could be driven by rising goods inflation, which may occur if companies ultimately decide to pass higher tariff-related costs on to consumers. Or inflation could be driven higher by rising services inflation, which makes up about two-thirds of the CPI basket, perhaps caused by a tight labor market and rising wage pressure.
In addition, any new policies that increase fiscal stimulus by means of stimulus checks or other government rebates could stoke the flames of inflation as well. For investors, the best guardrails against inflation in our view are investments in assets that outpace inflation rates over the long run, including allocations to a diversified set of equities and bonds.
Finally, a third potential risk to the outlook could come from stress in the credit markets, either public or private credit. Credit spreads in U.S. investment-grade and high-yield bonds remain tight, although they have been drifting higher. If we see a sharp rise in credit spreads, perhaps driven by concerns of defaults in parts of AI or other sectors, this could spark a broader disruption in financial markets. Similarly, private credit, which has been a rapidly growing income-generating segment of private markets, also remains vulnerable if higher-for-longer rates trigger defaults. While stress in both public and private credit markets has remained contained this cycle, an upheaval in these markets could amplify market volatility and tighten financial conditions. We continue to maintain a slight overweight to equities over bonds, and within the bond space, we recommend a diversified basket of investment-grade, high-yield, emerging-market and international bonds alongside appropriate allocations to cash positions.
Overall, we continue to believe that AI is not in a bubble, earnings will deliver, inflation can remain contained in the 2.5% – 3.0% range and credit markets will be benign in the year ahead. Nonetheless, if tail risks emerge to challenge these views, we believe investors who remain well diversified — across asset classes, sectors and geographies — can be best positioned to outperform.
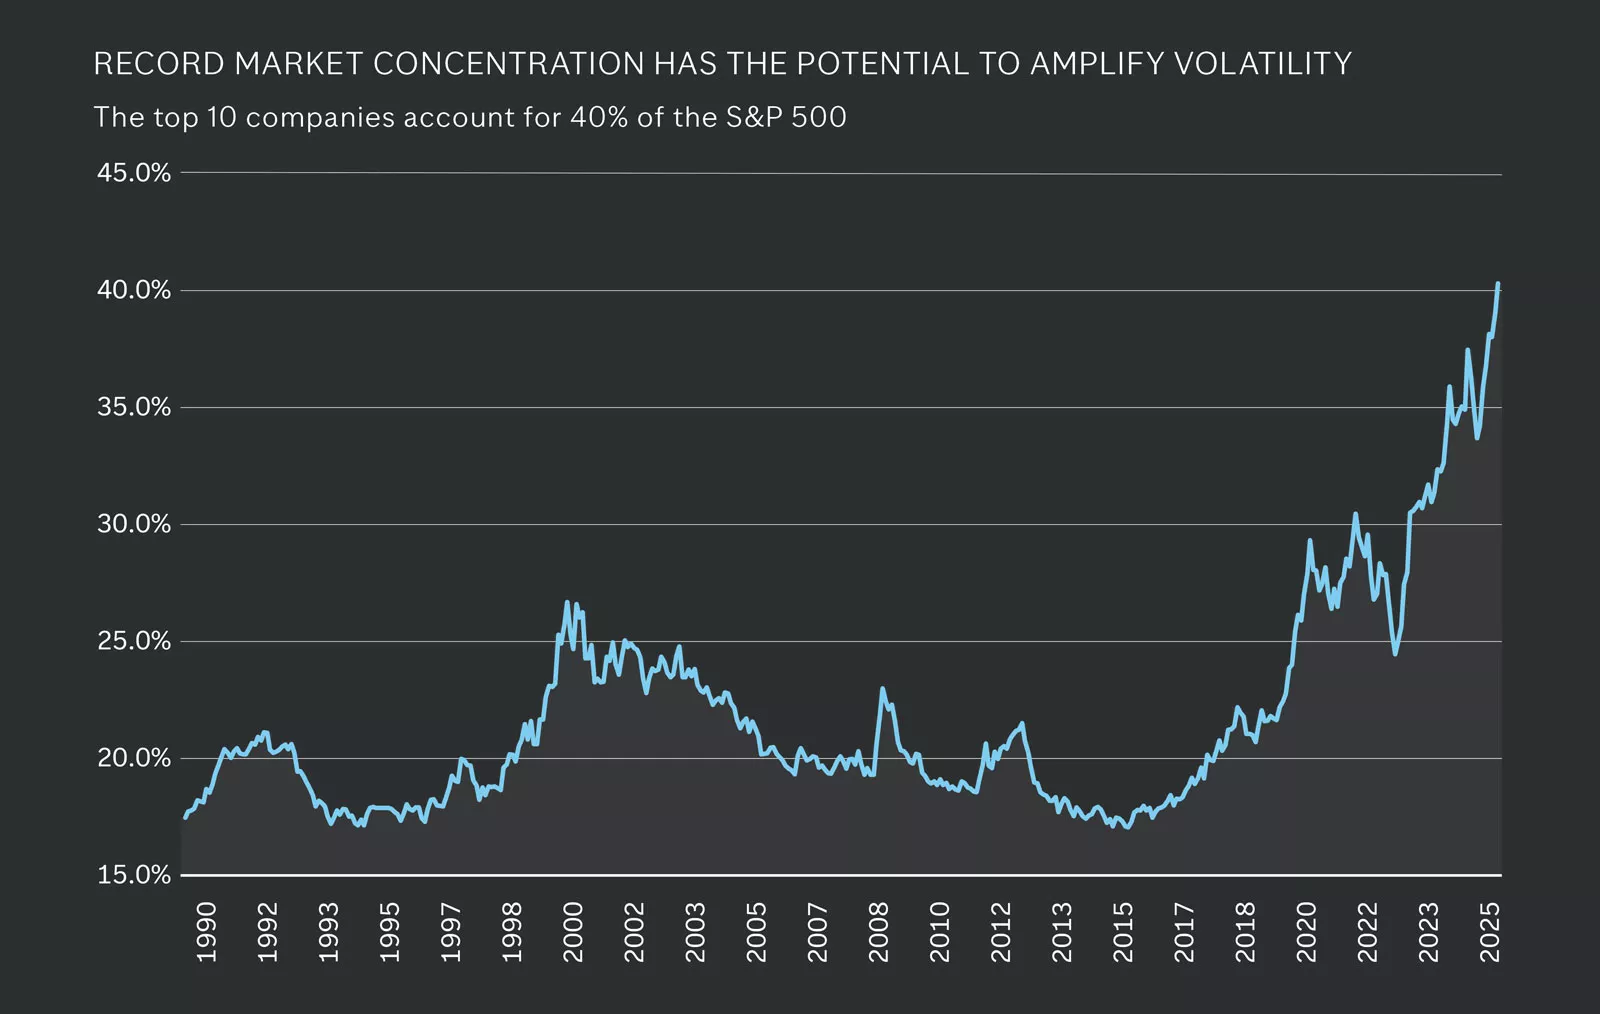
The graph shows that the top 10 companies of the S&P 500 by market capitalization now account for 40% of the index, a record concentration.
The graph shows that the top 10 companies of the S&P 500 by market capitalization now account for 40% of the index, a record concentration.