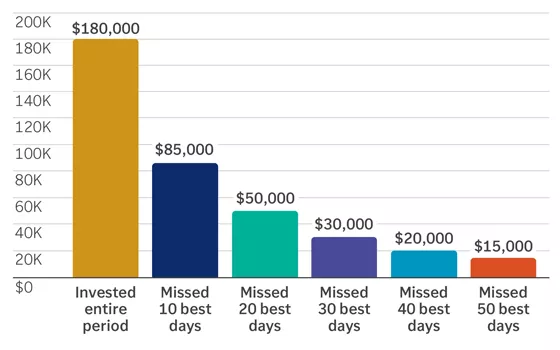
This chart shows that a $10,000 investment in the S&P 500 from 1994 to 2023 would have grown to $180,000 for investors who remained fully invested for the entire period. By comparison, the same investment would have grown to just $85,000 for those who missed the market’s 10 best days, $50,000 for those who missed the 20 best days, $30,000 for those who missed the 30 best days, $20,000 for those who missed the 40 best days and $15,000 for those who missed the 50 best days.
This chart shows that a $10,000 investment in the S&P 500 from 1994 to 2023 would have grown to $180,000 for investors who remained fully invested for the entire period. By comparison, the same investment would have grown to just $85,000 for those who missed the market’s 10 best days, $50,000 for those who missed the 20 best days, $30,000 for those who missed the 30 best days, $20,000 for those who missed the 40 best days and $15,000 for those who missed the 50 best days.
Important information:
1 Source: FactSet, Edward Jones calculations: 1/3/1928–12/31/2024. Past performance does not guarantee future results. Market indexes are unmanaged, cannot be invested into directly and are not meant to depict an actual investment.