Meagan Dow, CFA®, CFP®
Senior Strategist, Client Needs Research
Key takeaways
- Emotional investing happens when fear, excitement or panic drives investment decisions instead of your financial strategy and goals. This may lead to poor market timing, lower returns and long-term setbacks.
- Consistently investing in the stock market, diversifying your assets, and periodically rebalancing your portfolio are all positive alternatives to emotional investing.
- An Edward Jones financial advisor can help you stick to your strategy and make decisions based on goals, data and experience, while accounting for the emotions that investing can bring up.
What is emotional investing?
Emotional investing generally refers to making investment decisions based on anxiety, excitement, panic or fear, rather than logic, strategy and research. Emotional investing can decrease your long-term returns by triggering behaviors such as buying high in booming markets, selling low during downturns, or abandoning the strategy your financial advisor created with you.
Too often, our emotions can be the biggest barrier to our investment success. In these situations, it’s important to take a timeout and remember why you’re investing — your retirement, your child’s education, your legacy. A short-term market decline doesn’t change these long-term goals.

The graphic above reads: A timeout can help you review your goals and objectives, recognize behaviors that could cause trouble, and avoid making emotional investment decisions.
The graphic above reads: A timeout can help you review your goals and objectives, recognize behaviors that could cause trouble, and avoid making emotional investment decisions.
The result of our investing behavior
Why is it so important to be on your best investing behavior? Poor investing behavior can lead to insufficient diversification among different types of assets, chasing market performance, and moving into and out of the markets (often at the wrong time). The typical result of these behaviors is not a surprise: poor long-term performance. This could lead to the biggest risk of all: not reaching your long-term financial goals.
The consequences may be even more dramatic than you think. For example, the average annual return for a 65% stock/35% bond portfolio over the past 30 years was 8.7%. However, the average U.S. investor received a 6.5% return because of their investing behavior. But with the power of compounding, the difference wasn’t simply 2.2% a year; it could have been about $550,000 over that 30-year time frame.
When you feel your emotions beginning to get the better of you, take a timeout and work with your financial advisor to review your goals before making what could be an emotional investing decision. Your portfolio and your future self will thank you.
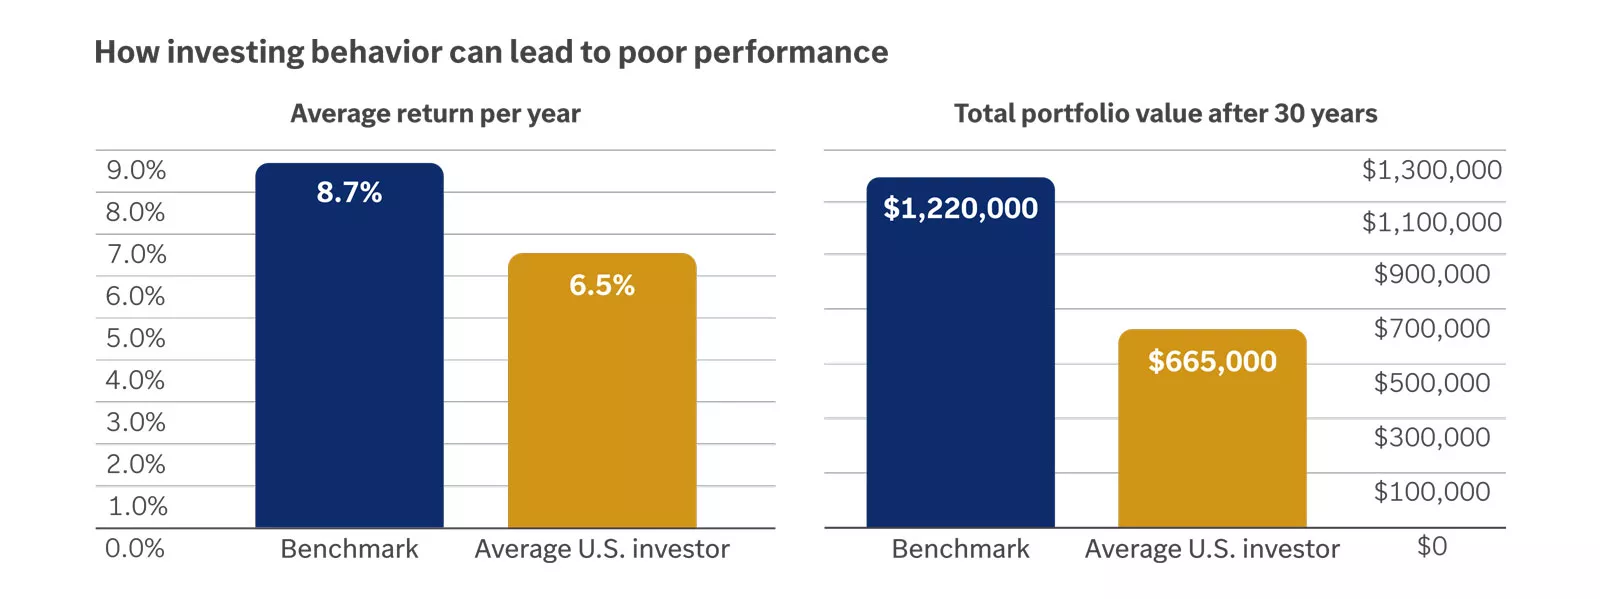
The chart shows how the average equity and bond investor in the U.S. underperforms benchmarks. It models a portfolio of 65% stocks and 35% bonds over a 30-year period ending in 2024. The two bars on the left compare average annual returns, with the benchmark portfolio returning 8.7% and the average investor returning 6.5%. The two bars on the right show that this means an initial investment of $100,000 would grow to $1,220,000 based on the benchmark portfolio return, but to only $665,000 for the average investor return.
The chart shows how the average equity and bond investor in the U.S. underperforms benchmarks. It models a portfolio of 65% stocks and 35% bonds over a 30-year period ending in 2024. The two bars on the left compare average annual returns, with the benchmark portfolio returning 8.7% and the average investor returning 6.5%. The two bars on the right show that this means an initial investment of $100,000 would grow to $1,220,000 based on the benchmark portfolio return, but to only $665,000 for the average investor return.
Investing behavior: Heading to (or staying on) the sidelines
Whether it’s the economy, the national deficit or market fluctuations, there will always be headlines that can distract you from focusing on your long-term goals. Trying to avoid potential stock market declines may lead to the following bad behaviors.
Trying to time the market
Some may try to time the market or sell to avoid additional declines. But to time the market successfully, you must get two decisions right: When to get out, and when to get back in. Getting one right is difficult; getting two right is nearly impossible.
Holding too much in cash
Others may hold too much in cash, thinking they are avoiding risk. However, this could increase the risk of not having enough growth in their portfolios to meet their goals or offset inflation.
Not staying fully invested or jumping into and out of the stock market can seriously affect performance, since many investors often get out after declines and then miss the positive moves. The effects of missing the best days can be substantial, as shown in the following chart.
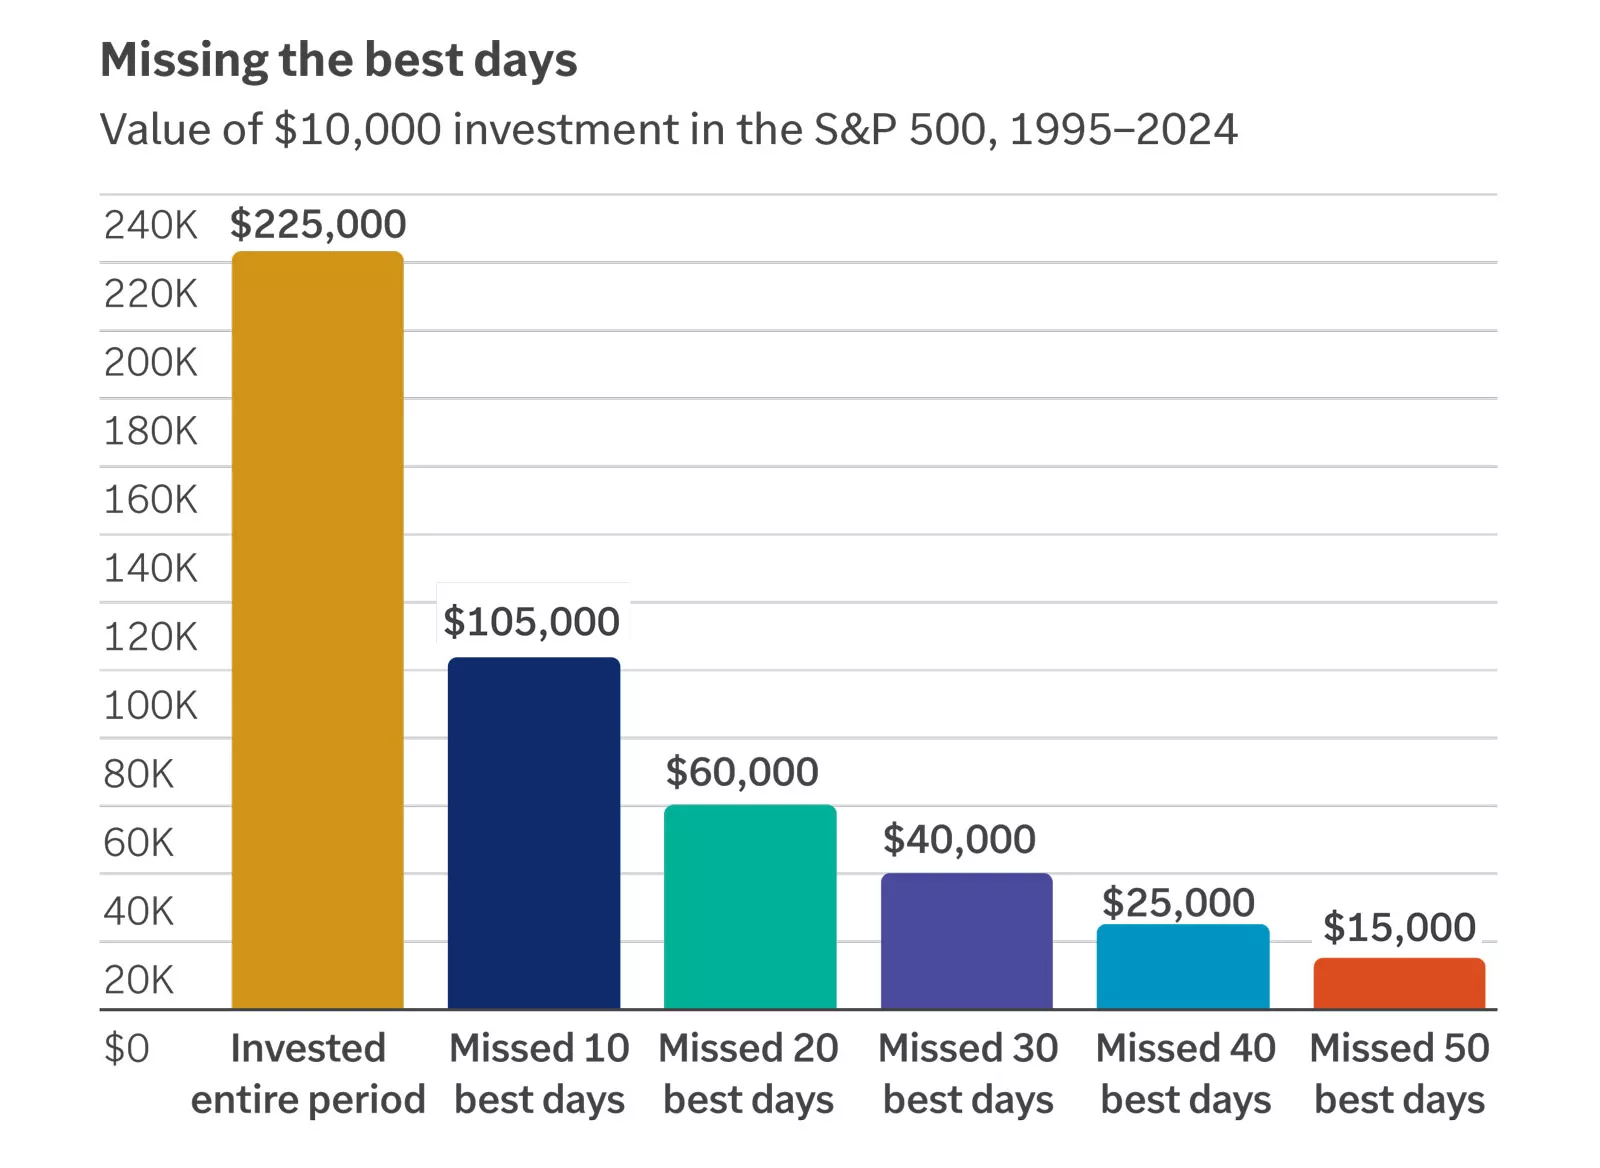
This chart illustrates the cost of missing the best days in the market. It shows that the ending value of a $10,000 investment in the S&P 500 from 1995 to 2024 for an investor remaining fully invested for the entire period would have been $225,000. By comparison, the same investment would have grown to just $105,000 for those who missed the market’s 10 best days, $60,000 for those who missed the 20 best days, $40,000 for those who missed the 30 best days, $25,000 for those who missed the 40 best days, and $15,000 for those who missed the 50 best days.
This chart illustrates the cost of missing the best days in the market. It shows that the ending value of a $10,000 investment in the S&P 500 from 1995 to 2024 for an investor remaining fully invested for the entire period would have been $225,000. By comparison, the same investment would have grown to just $105,000 for those who missed the market’s 10 best days, $60,000 for those who missed the 20 best days, $40,000 for those who missed the 30 best days, $25,000 for those who missed the 40 best days, and $15,000 for those who missed the 50 best days.
How to avoid this behavior
Avoid the headlines
When negative events occur, the media can appear to add to the drama by using strong headlines or highlighting historical information about previous issues. At times, this includes emphasizing poor market performance in ways that can set off alarm bells among investors. However, the BusinessWeek cover shown here preceded one of the strongest equity markets in history.
Focus on your long-term goals and not the ever-changing headlines, and remember we’ve successfully navigated tough periods before.
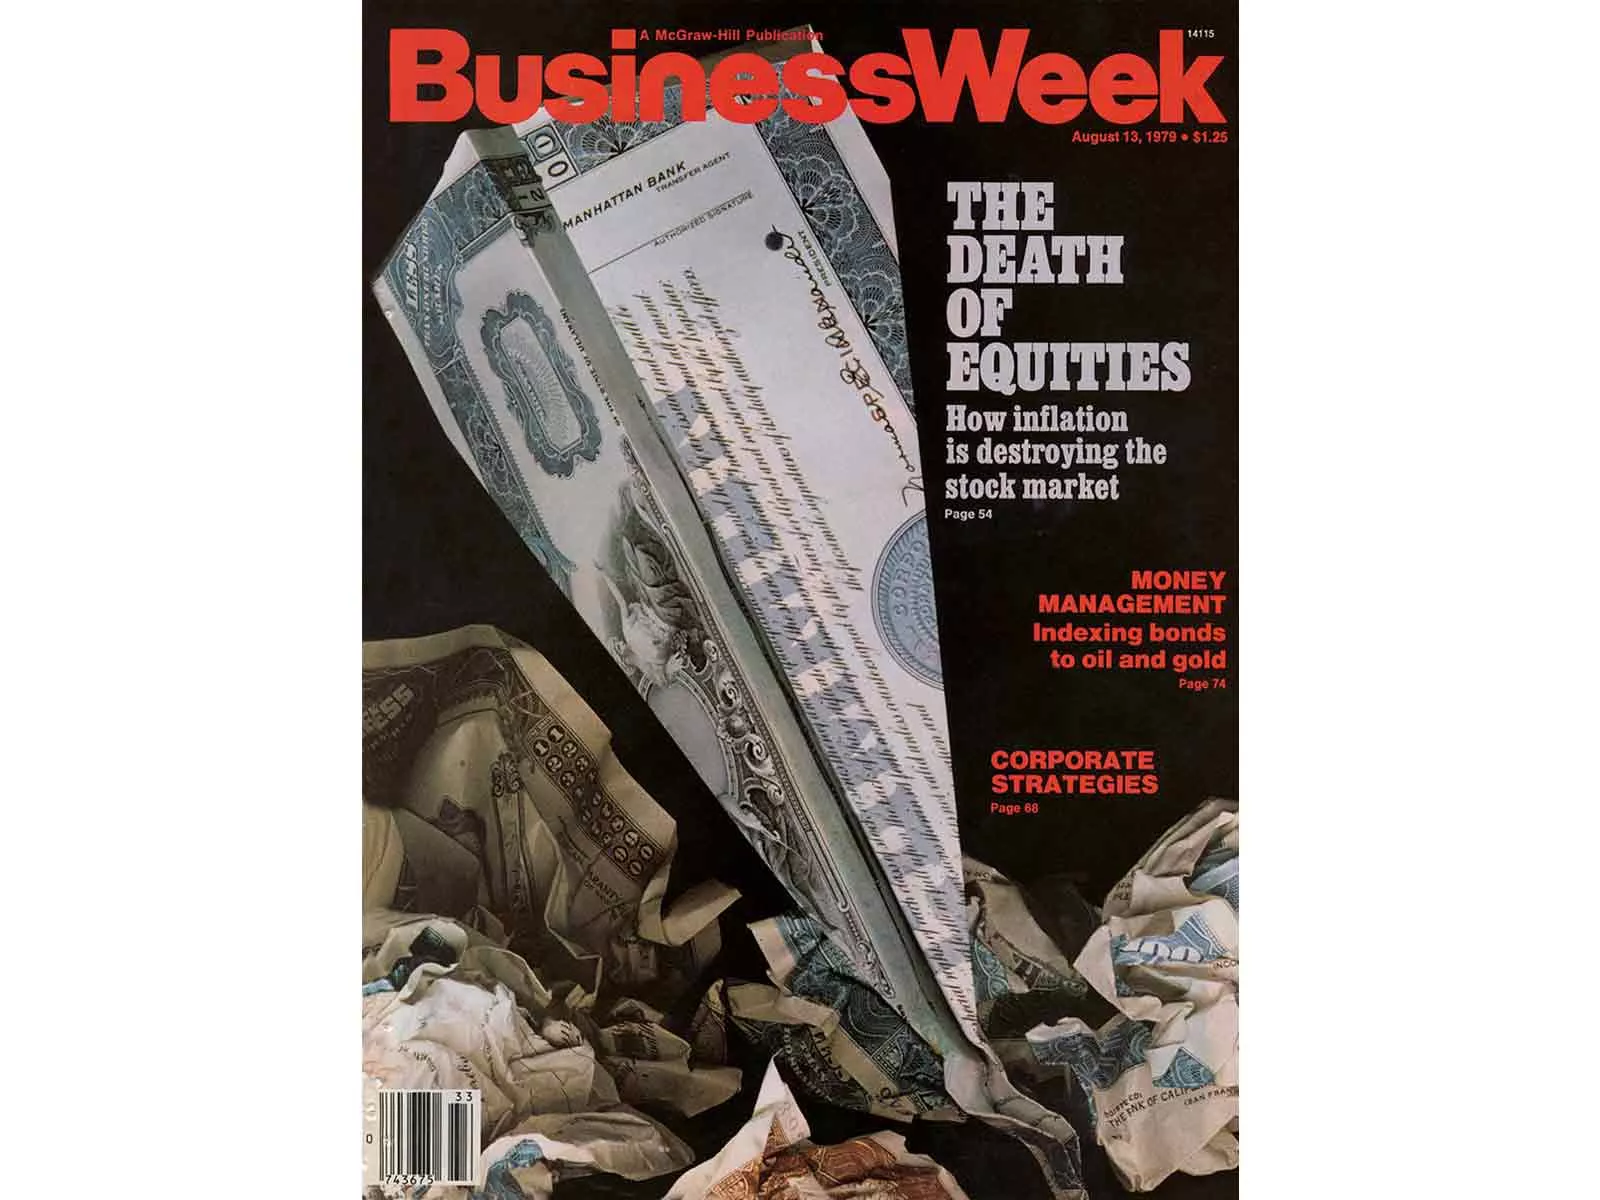
This photo shows a cover of BusinessWeek magazine focused on negative market news. It touts an article headlined “The Death of Equities: How inflation is destroying the stock market.”
This photo shows a cover of BusinessWeek magazine focused on negative market news. It touts an article headlined “The Death of Equities: How inflation is destroying the stock market.”
Know yourself
Talk with your financial advisor to better understand your attitudes toward risk and how you may react to specific events. By knowing in advance how you may react, you can be better prepared when the inevitable short-term declines occur.
Understand the risks of not investing
The biggest risk you may face is not reaching your long-term goals. Assuming a modest 3% inflation rate, prices will double during a normal 25-year retirement period. Look to growth investments to help keep pace with inflation.*
Investing behavior: Chasing performance
When the media hype the latest hot investment or highlight dramatic declines in the market, we’re often tempted to chase the winners and sell the losers. But this emotional response can lead to buying investments at market peaks and selling them at market lows — a recipe for underperformance.
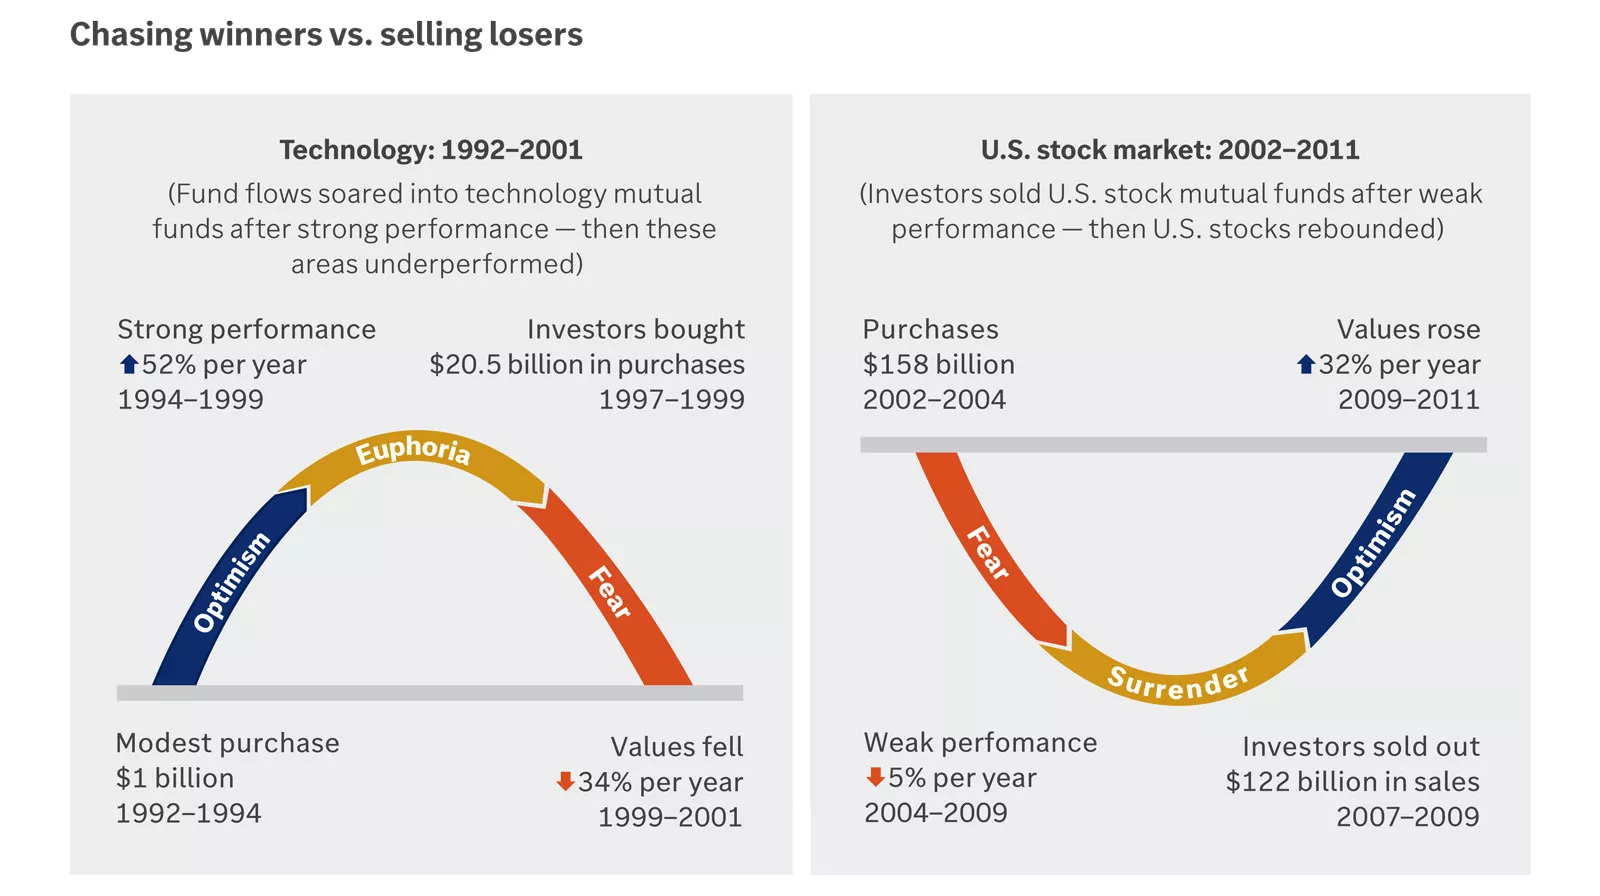
This graphic illustrates how investors crowd into and out of investments.
The chart on the left shows that fund flows soared into technology mutual funds after strong performance, but then they underperformed.
• In the two years prior to December 1994, $1 billion flowed into technology mutual funds.
• Over the next five years (December 1994 to December 1999), optimism caused tech stocks to generate an average return of 52% per year. This led to a period of euphoria, with investors pouring $20.5 billion into tech funds from December 1997 to December 1999 because of their strong performance.
• But over the following two years (December 1999 to December 2001), these stocks underperformed, falling 34% in value per year.
The chart on the right shows how investors sold U.S. stock mutual funds after weak performance, only to have those stocks rebound.
• In the two years prior to March 2004, investors bought $158 billion in U.S. stock mutual funds.
• At the bottom of the financial crisis, U.S. stocks suffered an average annual drop of 5% for the prior five years (March 2004 to March 2009). As markets faltered, investors sold $122 billion in U.S. stock funds from March 2007 to March 2009
• But markets turned optimistic in March 2009, climbing an average of 32% per year over the next two years (March 2009 to March 2011).
How to avoid this behavior
Stay diversified
Instead of trying to find the next hot investment and chasing performance, it’s important to spread your investments across assets and remain diversified. This helps ensure you have different types of assets and investments — each of which may perform differently at different times.
By chasing the leading asset class, you may end up with not only a lower portfolio return but also much less diversification than we would recommend. While diversification cannot guarantee a profit or protect against loss, it can help smooth out market ups and downs, potentially providing a better long-term experience.
The chart shows $25,000 invested each year into either a 65% stock/35% bond portfolio or the previous year’s best-performing asset class (winner).
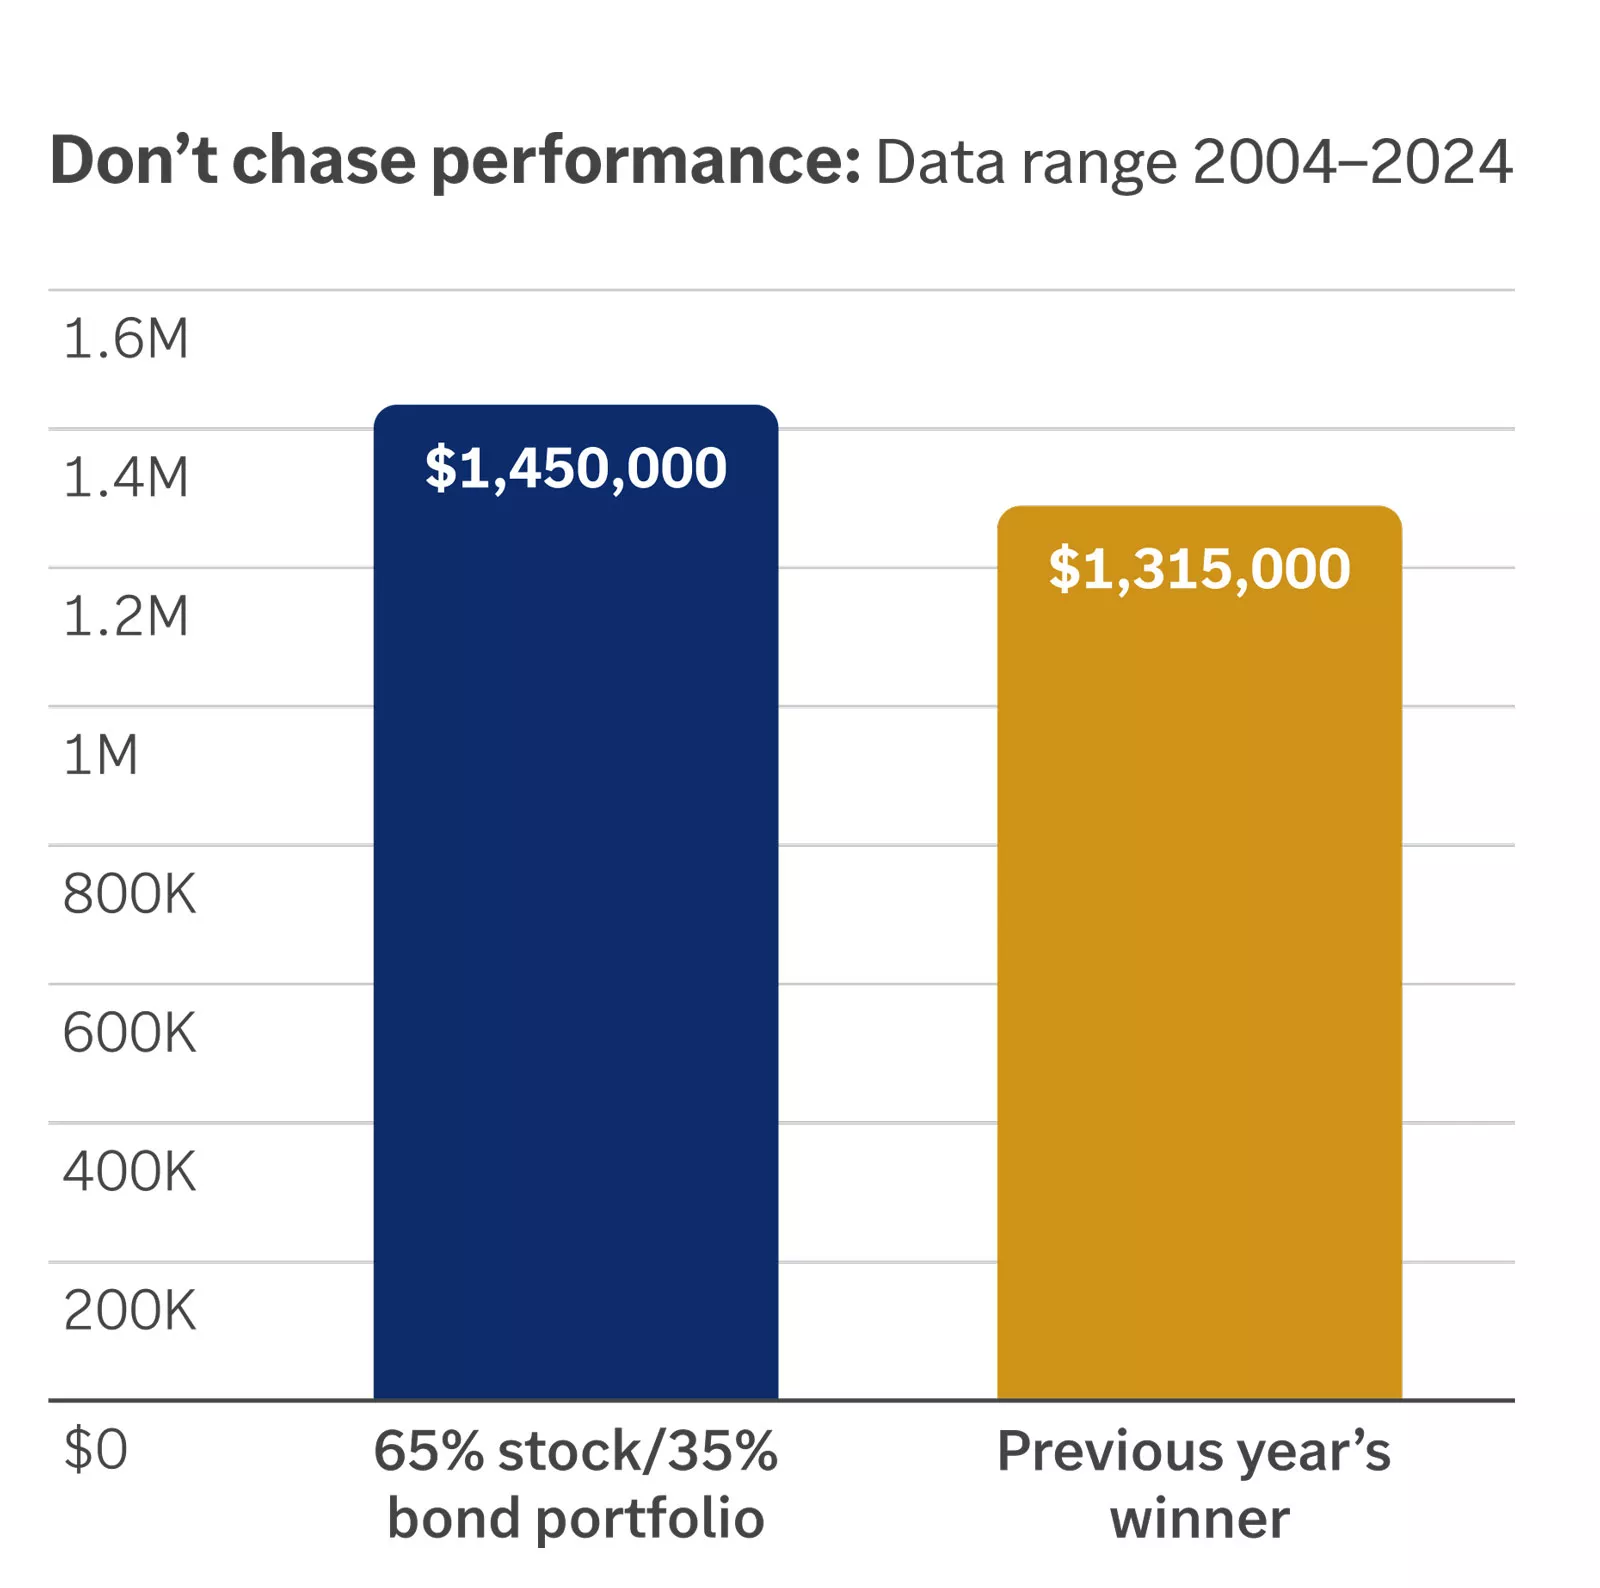
This bar chart shows that from 2004–2024, the consistent stock/bond portfolio would have grown to $1,450,000, whereas chasing the best-performing asset class would have increased to just $1,315,000.
This bar chart shows that from 2004–2024, the consistent stock/bond portfolio would have grown to $1,450,000, whereas chasing the best-performing asset class would have increased to just $1,315,000.
Investing behavior: Focusing on the short term
It’s important to focus on the long term, but day-to-day fluctuations can often get in the way, causing us to:
Fixate on a certain point in time
Depending on the vantage point, the same situation may look different. For example, some investors sold in 2008 because their portfolios had fallen from an all-time high value, even though their performance may still have been on track and well above where they initially began.
Base decisions on how the information is framed
Decisions can be influenced by how a situation is presented. For example, assuming a Dow Jones Industrial Average value of 30,000, one can say, “Dow plummets 300 points” or “Dow declines 1%.” Both describe the same situation, but the first sounds worse. With the Dow at about 40,000, we should expect larger point moves, but how the media present market movements can lead investors to make emotional short-term decisions.
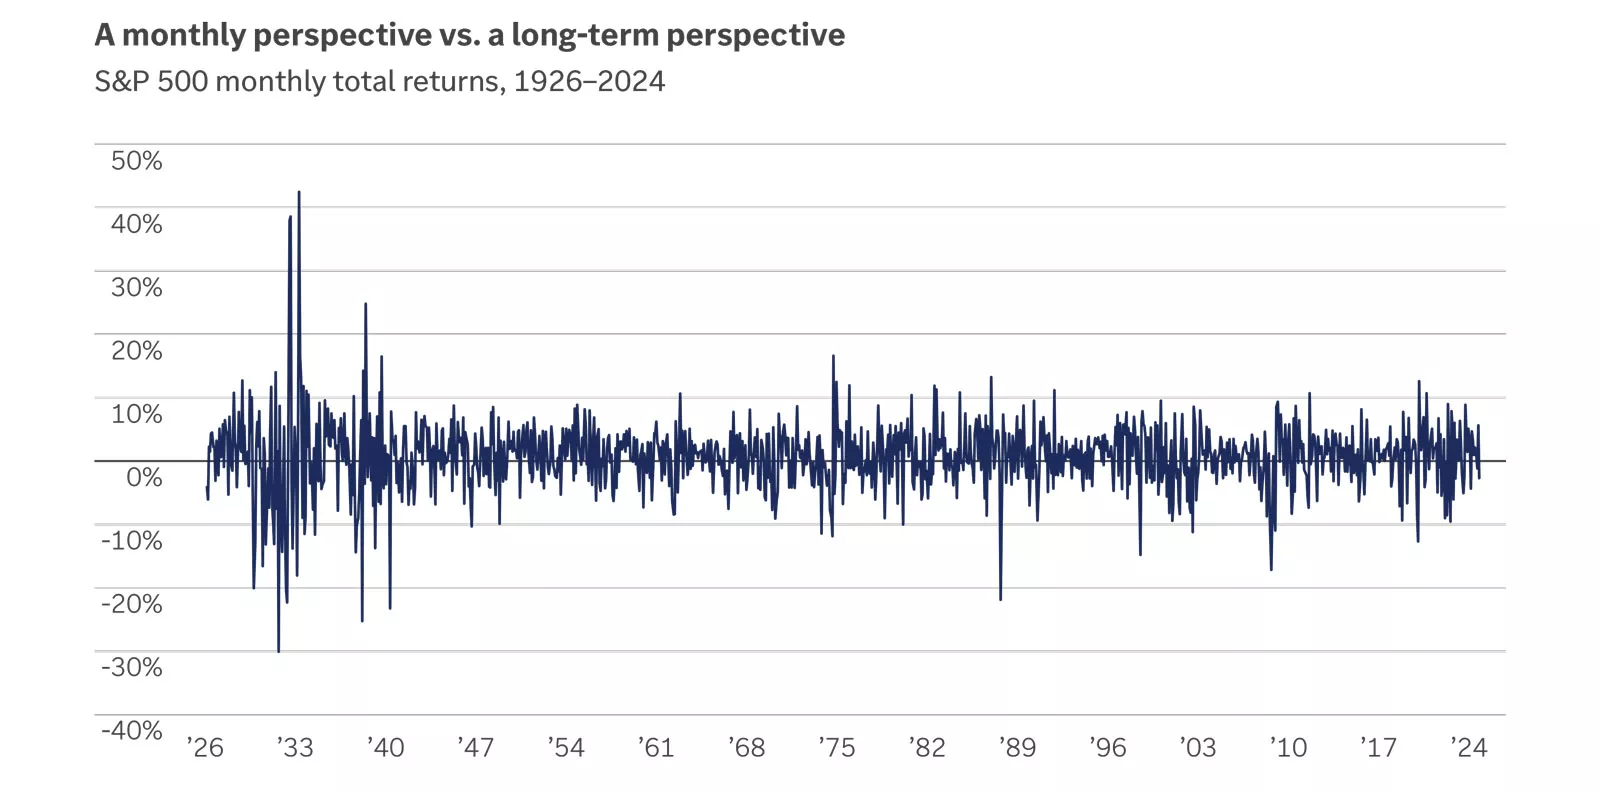
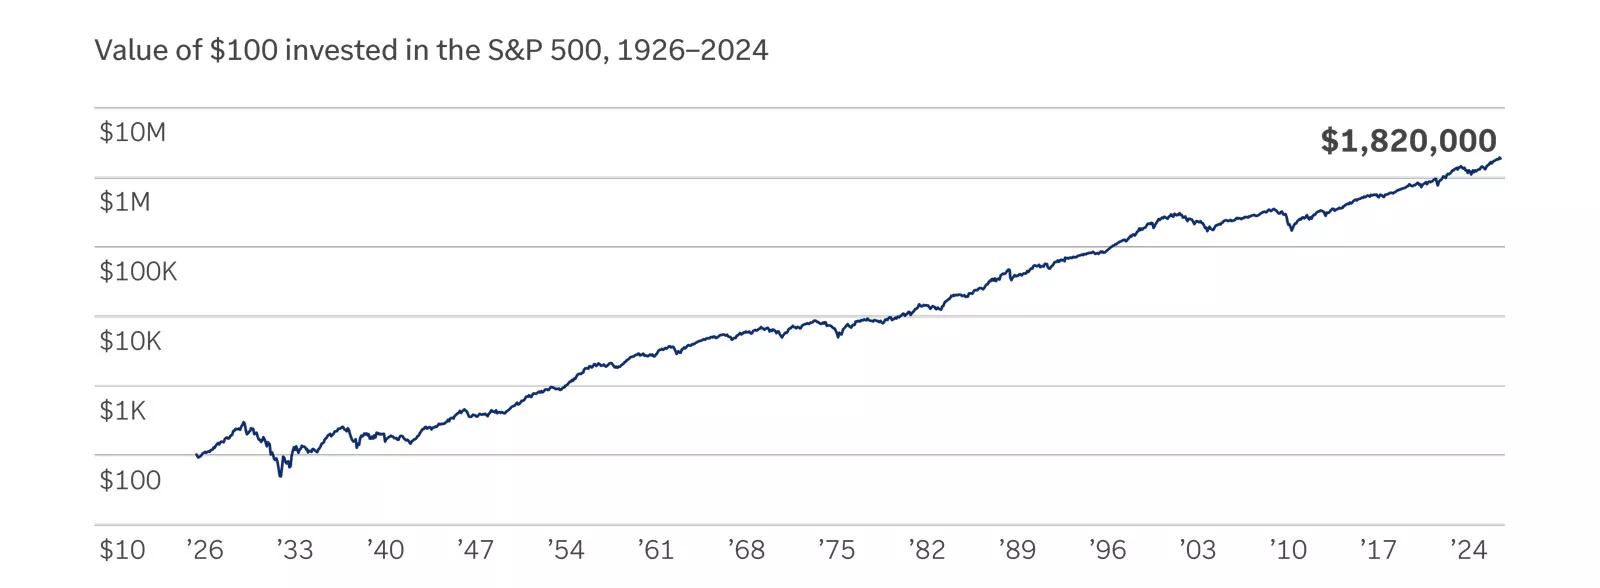
It all depends on your perspective, as highlighted below. The graphs show the same performance but from a different perspective. The top graph shows monthly fluctuations in the S&P 500, and the bottom shows its long-term performance — illustrating why it’s important to keep a long-term focus.
Value of $100 invested in the S&P 500 Total Return Index from 1926 to 2024
The first chart shows monthly returns in the S&P 500 from 1926 to 2024. Monthly performance ranged from a maximum loss of nearly 30% to a maximum gain of more than 40%. There are no clear patterns, highlighting short-term volatility.
The second chart showcases the long-term growth of a $100 investment in the S&P 500 over the same period. The initial investment generally expands steadily to $1,820,000 in 2024.
How to avoid this behavior
Set realistic expectations and focus on your goals
The stock market averages a 10% correction every year. There have been 33 bear markets and 33 recoveries since 1928. Over a 25-year retirement, you could experience eight to nine bear markets on average.
So, market declines, while unpleasant, are in fact normal. Measure your performance as progress toward your long-term goals, not in day-to-day fluctuations.
Understand the purpose of your investments
In retirement, some investments provide you with income today. Others are there to help provide income many years from now. Each serves a crucial role in helping ensure your money lasts as long as you need it.
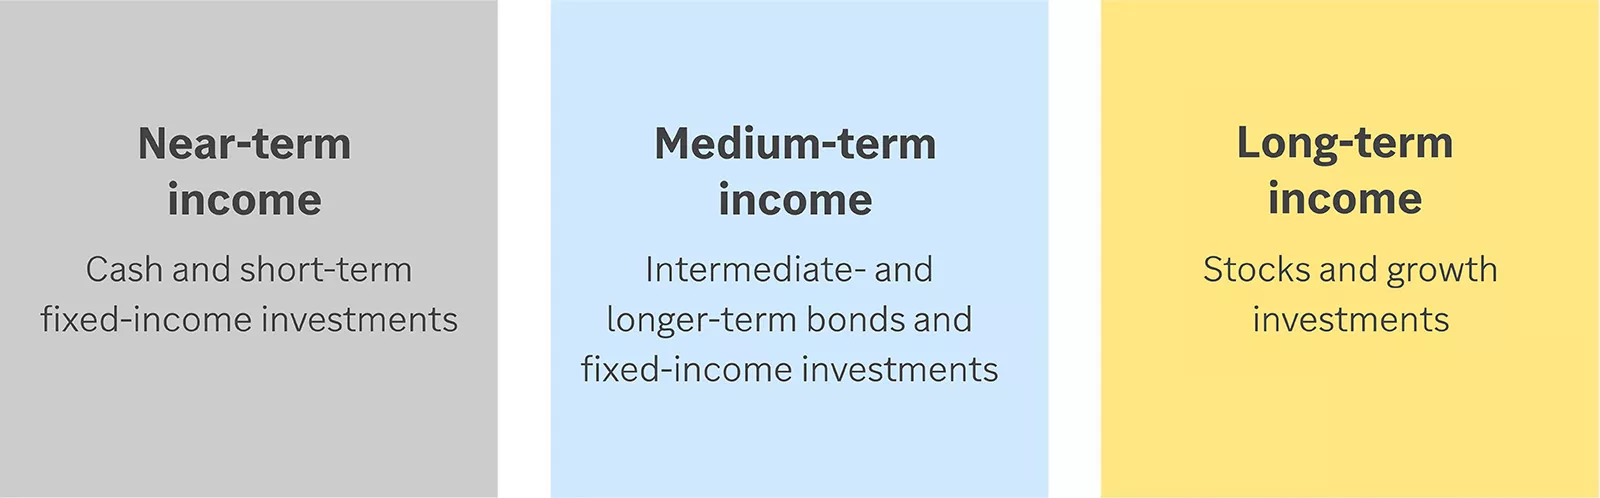
The graphic above illustrates the roles of different investments:
• Cash and short-term fixed-income investments can be thought of for near-term income needs.
• Intermediate- and longer-term bonds and fixed-income investments can be thought of for medium-term income needs.
• Stocks and growth investments can be thought of for long-term income needs.
Meagan Dow
Meagan Dow is a senior strategist on the Advice & Planning Research team at Edward Jones. The Advice & Planning Research team develops and communicates advice and guidance for financial planning needs, including retirement, healthcare, preparing for the unexpected and leaving a legacy. Meagan has over 15 years of financial services and investment experience. She is a contributor to the Edward Jones Perspective newsletter and has been quoted in various publications.
Important Information:
* Investing in equities involves risk. The value of your shares will fluctuate, and you may lose principal.
This information is for educational and illustrative purposes only and should not be interpreted as specific investment advice. Investors should make investment decisions based on their unique investment objectives and financial situation.
Investors should understand the risks involved in owning investments, including interest rate risk, credit risk and market risk. The value of investments fluctuates, and investors can lose some or all of their money.