Rising rates, resilient economy: What history suggests for markets
Key Takeaways:
- Recent inflation data improved, with core PCE inflation rising 3.0% from a year ago in August, while shorter-term measures showed further moderation. Revisions also indicated that inflation earlier this year was lower than previously estimated.
- Despite some cooling in hiring, strong consumer spending, a resurgence in manufacturing activity, and robust corporate profit growth suggest that the broader economy remains on solid footing.
- Rising Treasury yields may test market resilience, but we think the increase has partly reflected healthy economic growth. History also suggests that sharp increases in yields do not necessarily derail equities when the economic backdrop remains supportive.
- We believe resilient economic growth and rising corporate profits can help equities navigate elevated interest rates, supporting our preference for equities over fixed income.
October is upon us, bringing cooler weather, autumn leaves and, most importantly for sports fans, postseason baseball. The 2026 season delivered no shortage of surprises, while at the same time, traditional powers such as the New York Yankees and Los Angeles Dodgers are once again in the postseason picture and competing for a title.
Financial markets have delivered their own share of surprises in 2026. Long-term bond yields have reached multidecade highs, diesel prices have climbed to record levels, and the Federal Reserve reversed course by raising interest rates in September after both we and financial markets entered the year expecting multiple rate cuts. Yet, much like the continued presence of baseball’s perennial contenders in October, many of the fundamental forces supporting markets over the past year remain intact. Corporate profit growth remains robust, the economy has proven resilient, and investment related to artificial intelligence continues to support growth and markets in the U.S. and abroad.
In this week’s report, I’ll spare you my predictions for how the pennant race will unfold. Instead, we’ll unpack the latest economic data, examine what history suggests about stock-market performance following sharp increases in bond yields, and consider what these trends could mean for investors in the final stretch of the year.
Inflation looks better in the rearview mirror
Last week brought encouraging news on inflation. Core personal consumption expenditures (PCE) inflation, which excludes volatile food and energy prices and is closely watched by the Federal Reserve, rose 3.0% from a year ago in August. Recent trends were even more encouraging. The three-month annualized rate slowed to 2.0%, reaching the Fed’s target for the first time in more than two years, while the six-month annualized rate declined to 2.7%, its lowest since December of last year.
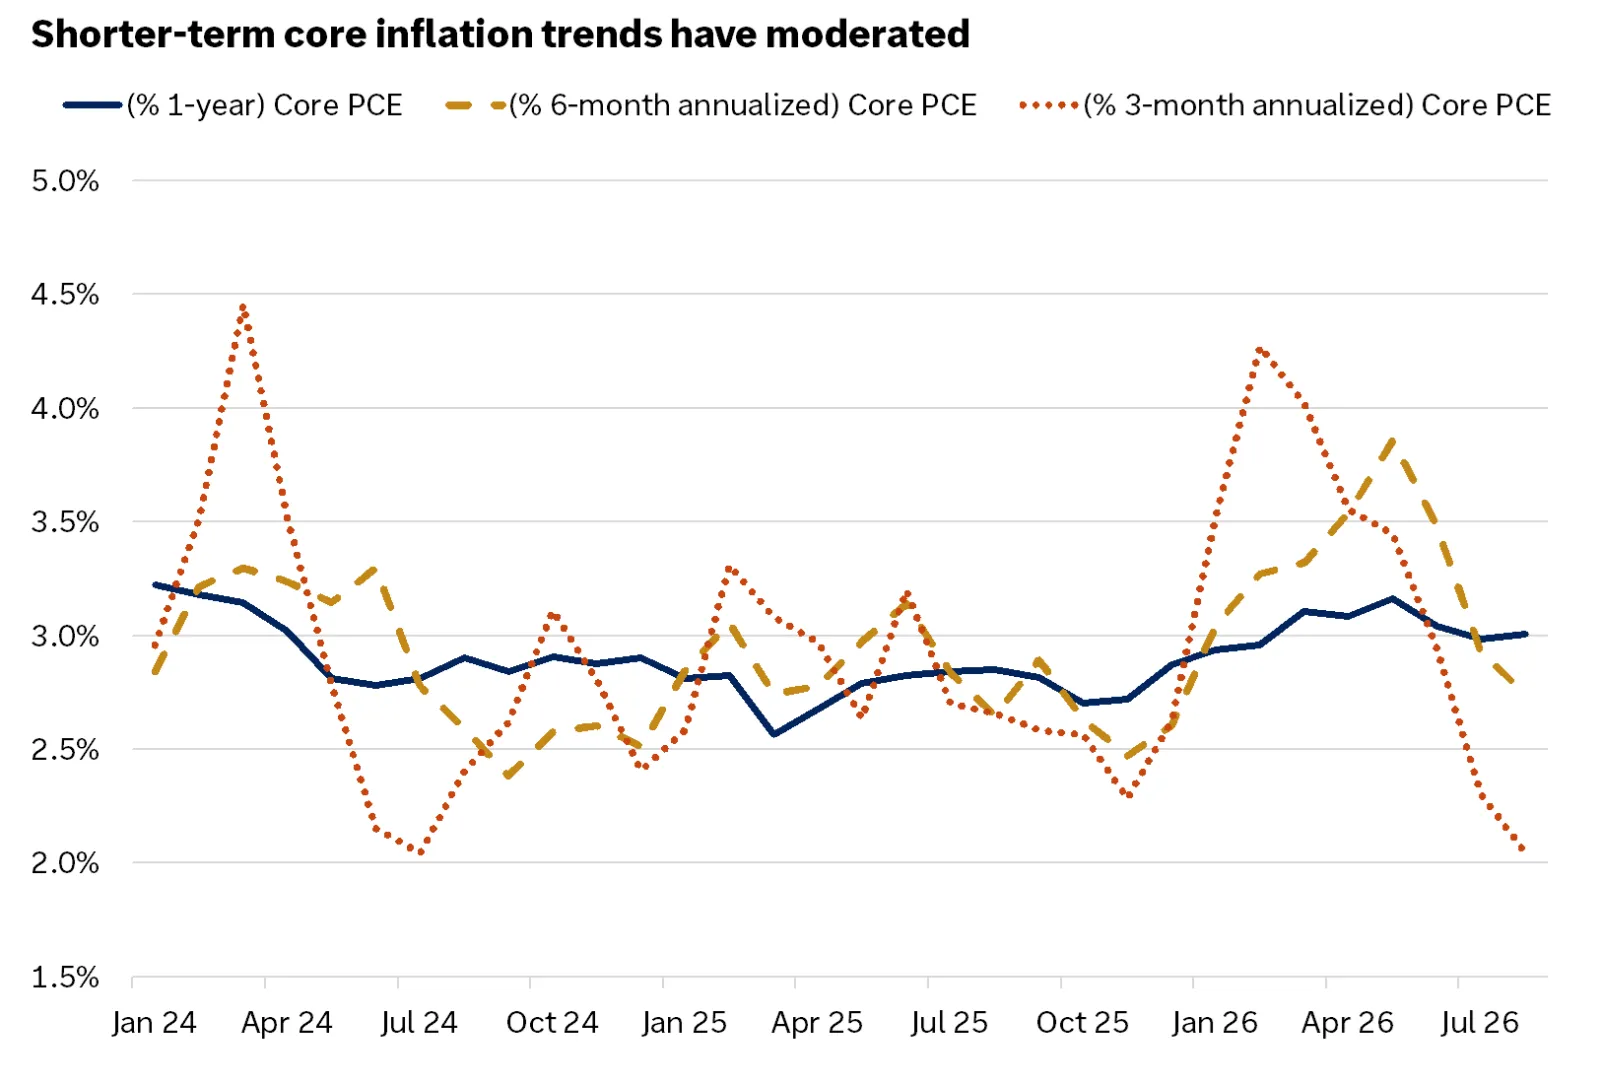
The chart shows that core PCE inflation in the U.S. has shown signs of moderation in recent months, with the 3-month annualized change falling to 2% in August.
The chart shows that core PCE inflation in the U.S. has shown signs of moderation in recent months, with the 3-month annualized change falling to 2% in August.
Annual revisions from the Bureau of Economic Analysis also showed that inflation this year had been lower than previously reported. Using the revised data released in September, core PCE inflation has averaged 3.0% year over year during the first eight months of 2026, down from the 3.3% average based on the data available in August.1
Still, at 3.0%, core inflation remains uncomfortably high for policymakers, particularly amid lingering uncertainty in the Middle East and signs from last week’s ISM Manufacturing survey that input-price pressures remain elevated. However, encouraging PCE data over recent months, softer-than-expected employment figures, and dovish-leaning comments from Federal Reserve officials tempered expectations for another rate hike in October. While these developments may give policymakers greater flexibility over the timing of future moves, lingering geopolitical risks and still above-target inflation suggest to us that the hiking cycle is not yet complete. Our base case calls for two additional rate increases, which we see as a midcycle adjustment rather than the start of a more aggressive tightening cycle.
Economic momentum remains resilient
In addition to encouraging news on inflation, last week provided further evidence that underlying economic momentum remains healthy.
- Labor market: Last Friday’s payrolls report showed that nonfarm employment rose by 29,000 in September, well below consensus expectations, while the unemployment rate edged higher to 4.2%. However, the increase in unemployment partly reflected an encouraging development, as growth in the labor force outpaced employment growth during the month. Taking a step back, nonfarm-payroll growth has averaged roughly 68,000 per month this year, a pace we view as healthy given the decline in the labor force since the end of 2025.
- Consumer spending: Consumer spending has remained strong in recent months, with real personal consumption rising 0.6% in August and 2.6% from a year earlier. In addition, second-quarter real GDP growth was revised higher, from an annualized rate of 1.5% to 2.2%, primarily reflecting upward revisions to consumer spending along with stronger investment.
- Corporate profits: Corporate earnings have been an important source of market support this year, with S&P 500 earnings expected to grow by more than 30%, driven in large part by AI-related gains. Encouragingly, we see signs that this strength is extending beyond the largest publicly traded companies. NIPA corporate profits, a broad measure of earnings across the U.S. corporate sector published by the Bureau of Economic Analysis, posted their strongest year-over-year increase outside of postrecession periods since 2012 in the second quarter.
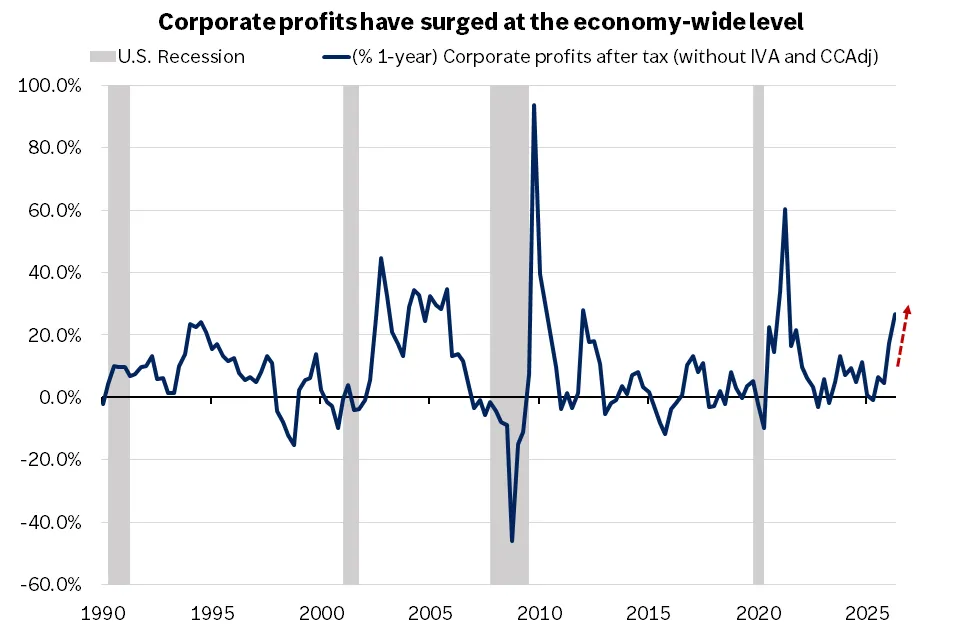
The chart shows that NIPA corporate profits have risen in recent quarters, signaling broad-based strength in corporate earnings in our view.
The chart shows that NIPA corporate profits have risen in recent quarters, signaling broad-based strength in corporate earnings in our view.
- Manufacturing: The manufacturing sector continues to emerge from a multiyear slowdown, with the ISM Manufacturing Purchasing Managers' Index (PMI) holding steady at 54.5 in September, comfortably in expansion territory. Although manufacturing represents a relatively small share of the U.S. economy, the sector’s sensitivity to changes in the business cycle makes it a useful barometer of broader economic conditions. This relationship is also evident in the historically strong correlation between the ISM Manufacturing PMI and corporate earnings growth. The recent improvement in manufacturing activity therefore provides another encouraging signal for the earnings outlook, in our view.
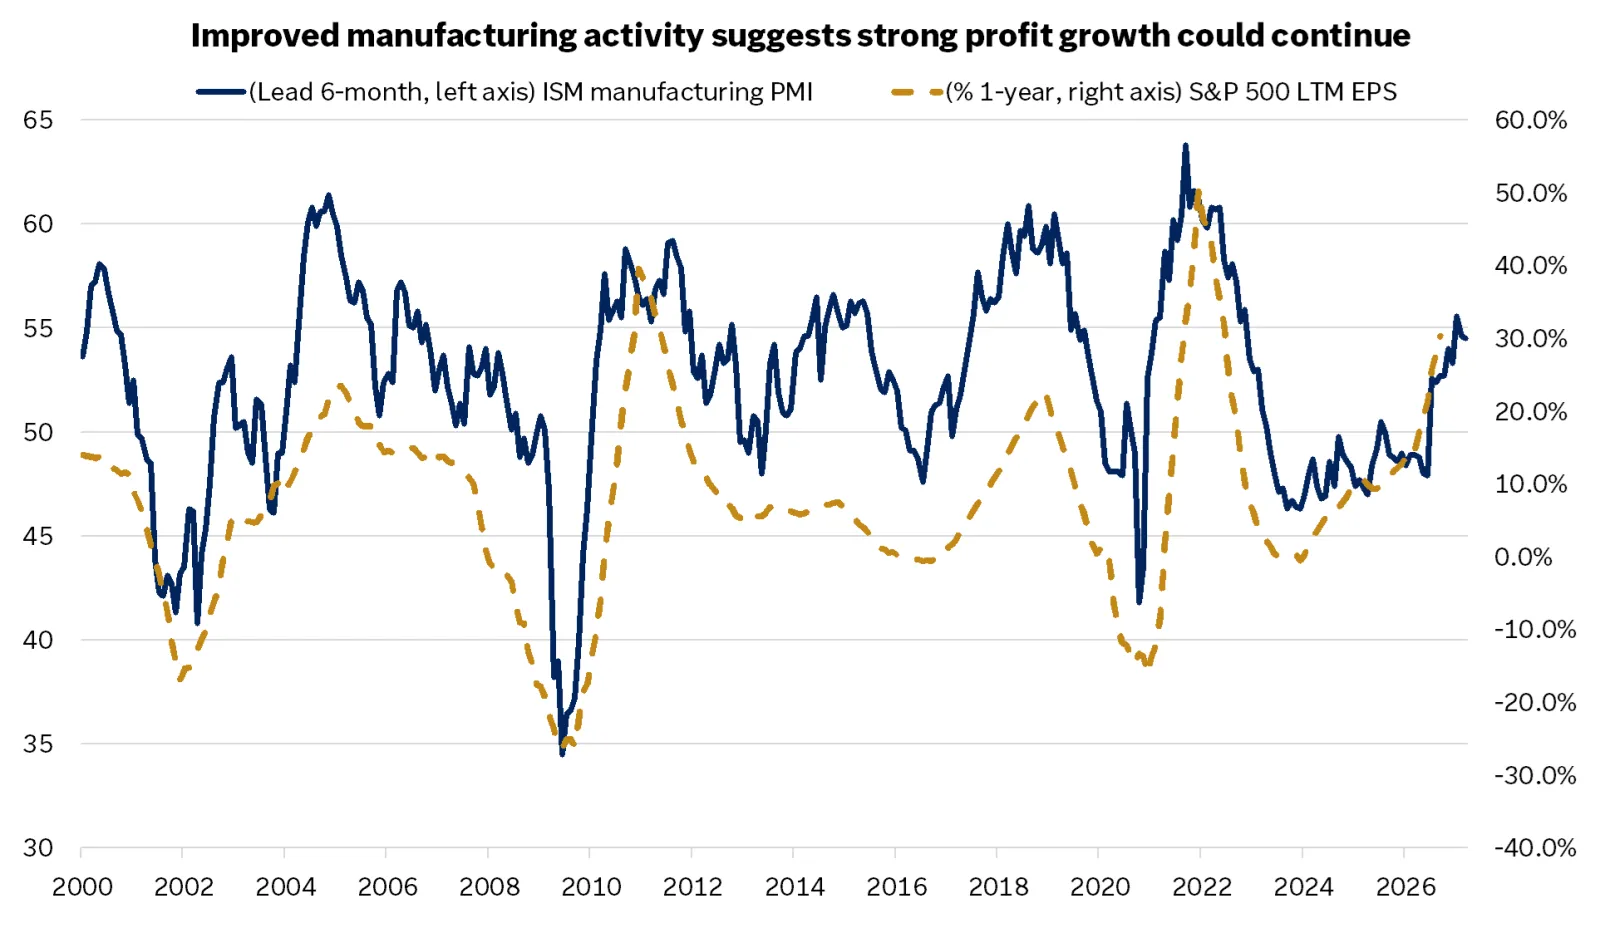
The chart shows that historically, a stronger ISM manufacturing PMI has been accompanied by rising earnings per share growth for the S&P 500. The recent strength in manufacturing could signal ongoing resilience in corporate profits.
The chart shows that historically, a stronger ISM manufacturing PMI has been accompanied by rising earnings per share growth for the S&P 500. The recent strength in manufacturing could signal ongoing resilience in corporate profits.
While elevated borrowing costs, tightening monetary policy, and geopolitical uncertainty pose risks to economic and market momentum, recent data suggest that broader economic conditions remain on solid footing. In our view, this resilience should remain an important source of support for equity markets through year-end.
What history suggests after sharp increases in yields
Rising interest rates have been front and center for investors over the past month, and for good reason. Since 1990, there have been just six months, including this September, in which both the 2-year and 10-year Treasury yields rose by at least 50 basis points (0.5%). Following the five previous episodes, the S&P 500 generated a positive return four times over the subsequent six months and three times over the subsequent three months. While not shown in the table, 12-month forward returns followed a similar pattern, with positive returns in all instances except 2002.

The table shows that in the five months outside of September 2026 where both the 2-year and 10-year Treasury yields rose by 0.5% or more in a given month, average six month forward returns were positive in four of five instances and positive in three of five instances over the subsequent three months. When accounting for the times when trailing six-month payroll growth was positive, returns were positive in each of the four instances over the subsequent six months and in three of four instances over the subsequent three months.
The table shows that in the five months outside of September 2026 where both the 2-year and 10-year Treasury yields rose by 0.5% or more in a given month, average six month forward returns were positive in four of five instances and positive in three of five instances over the subsequent three months. When accounting for the times when trailing six-month payroll growth was positive, returns were positive in each of the four instances over the subsequent six months and in three of four instances over the subsequent three months.
The economic backdrop appears to be an important distinction. March 2002 was the only previous episode in which the S&P 500 declined over the subsequent six and 12 months. At the time, nonfarm payrolls had fallen by an average of 173,500 per month over the preceding six months, and the Nasdaq Composite was more than 60% below its March 2000 peak. Although the 2001 recession had officially ended in November of that year2, the recovery remained fragile, with payroll employment and industrial production still well below their prerecession peaks.
By contrast, through September, nonfarm payrolls have increased by an average of 65,700 per month over the past six months, while robust corporate earnings and resilient economic activity have supported equity markets this year. The recent rise in yields has also partly reflected this economic resilience, in our view. Although the sample size is limited and there is no perfect analogue for today's environment, today’s healthy economic backdrop appears more comparable with the non-2002 episodes. Higher interest rates may periodically test equity-market resilience, but healthy economic activity and rising corporate profits should remain important sources of support through year-end.
What this means for investors
We continue to view the economic and market backdrop as supportive for equity markets, underpinned by stable labor-market conditions, resilient economic activity, and strong corporate profit growth. Therefore, we recommend investors overweight equities relative to fixed-income, in line with their financial goals and risk tolerance.
Within U.S. equity markets, we believe opportunities are most attractive in U.S. large- and mid-cap stocks, which we view as well positioned to benefit from economic resilience and AI exposure. Overseas, we prefer emerging-market stocks to developed international markets, and we believe that value-style stocks are attractive on a relative basis compared to growth-style stocks within international developed markets.
As in postseason baseball, success rarely depends on a single player or facet of the game, and surprises are the norm. Markets will likely deliver their own unexpected turns, but a diversified portfolio with exposure to a variety of asset classes and regions can help keep investors’ long-term goals on track, in our view. With economic growth proving resilient and corporate profits on the rise, we believe equities remain well positioned as we enter the final stretch of the year.
Brock Weimer, CFA
Investment Strategy
Source for all data in commentary not cited: FactSet.
Sources for data cited in commentary:
- Archival Federal Reserve Economic Data (ALFRED).
- Federal Reserve Economic Data, NBER based recession indicators for the United States from the period following the peak through the trough.
Brock Weimer
Brock Weimer is responsible for analyzing economic data, assessing market trends, and supporting the development of resources that help clients work toward their long-term financial goals.
Brock graduated from Southern Illinois University Edwardsville with a bachelor's degree in economics and finance. He is a CFA® charter holder and member of the CFA Institute and CFA Society of St. Louis.
Previous weeks' weekly market wraps
9/25: Navigating a Higher Interest Rate World
9/18: What the Fed's first hike in three years means for investors
9/11: Oil Raised the Question, CPI Delivered the Answer
9/4: Three Datapoints the Fed Is Likely Watching Ahead of the September FOMC Meeting
8/28: A Clearer Path into September
8/21: A roller-coaster week for rates: Separating opportunity from risk
Important Information:
The Weekly Market Update is published every Friday, after market close.
This is for informational purposes only and should not be interpreted as specific investment advice. Investors should make investment decisions based on their unique investment objectives and financial situation. While the information is believed to be accurate, it is not guaranteed and is subject to change without notice.
Investors should understand the risks involved in owning investments, including interest rate risk, credit risk and market risk. The value of investments fluctuates and investors can lose some or all of their principal.
Past performance does not guarantee future results.
Market indexes are unmanaged and cannot be invested into directly and are not meant to depict an actual investment.
Diversification does not guarantee a profit or protect against loss in declining markets.
Systematic investing does not guarantee a profit or protect against loss. Investors should consider their willingness to keep investing when share prices are declining.
Dividends may be increased, decreased or eliminated at any time without notice.
Special risks are inherent in international investing, including those related to currency fluctuations and foreign political and economic events.
Before investing in bonds, you should understand the risks involved, including credit risk and market risk. Bond investments are also subject to interest rate risk such that when interest rates rise, the prices of bonds can decrease, and the investor can lose principal value if the investment is sold prior to maturity.