The Pulse of North America
Across North America, our Edward Jones financial advisors are having conversations with millions of households about their concerns, goals, and how they're making sense of the world around them. Our Pulse of North America series brings those insights forward – exploring the forces shaping financial life right now.
Living in the K-shaped economy
Across the U.S., the same economy is producing different financial experiences. This K‑shaped dynamic – driven by gaps in wages, inflation exposure and asset ownership – is evident in the data and conversations our financial advisors are having every day.
Here, we explore the forces behind this divergence, what it means for investors and growth, and how individuals can navigate uncertainty and build toward long‑term financial progress.
At a glance
Everyone is talking about a K-shaped economy.
This catchy phrase is being used to describe a seeming split across U.S. households, with wealthier consumers spending more freely, while less well-off Americans seemingly struggle.
The K analogy comes to life across a range of economic data. Higher income households - the metaphorical top arm of the K - feel more optimistic about their finances and the economy and account for nearly 70% of spending. Meanwhile, households towards the bottom of the income distribution – the lower arm of the K – are feeling more downbeat and even showing some signs of financial distress, amid rising delinquencies for auto loans and credit cards.
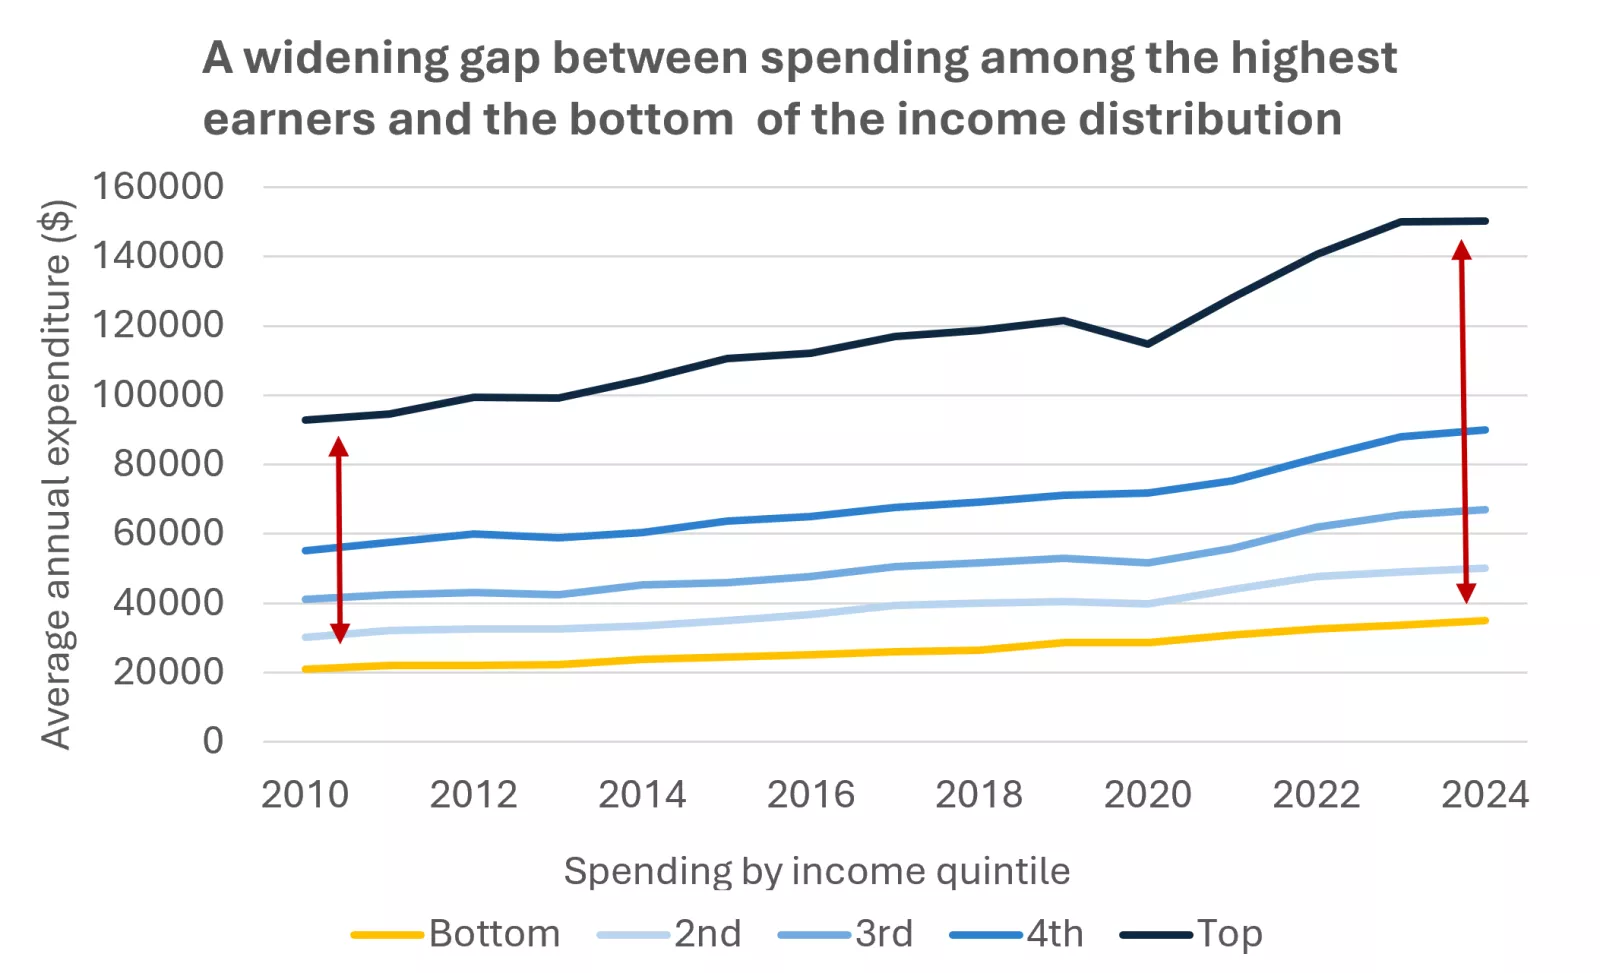
Source: U.S. Bureau of Labor Statistics
Edward Jones Pulse of North America trend:
The patterns of a K-shaped economy have also emerged across the millions of U.S. families that our financial advisors serve. We use our data insights which captures this huge cross section of households, behaviors and portfolios trends to better understand the economic and financial conditions across the continent.
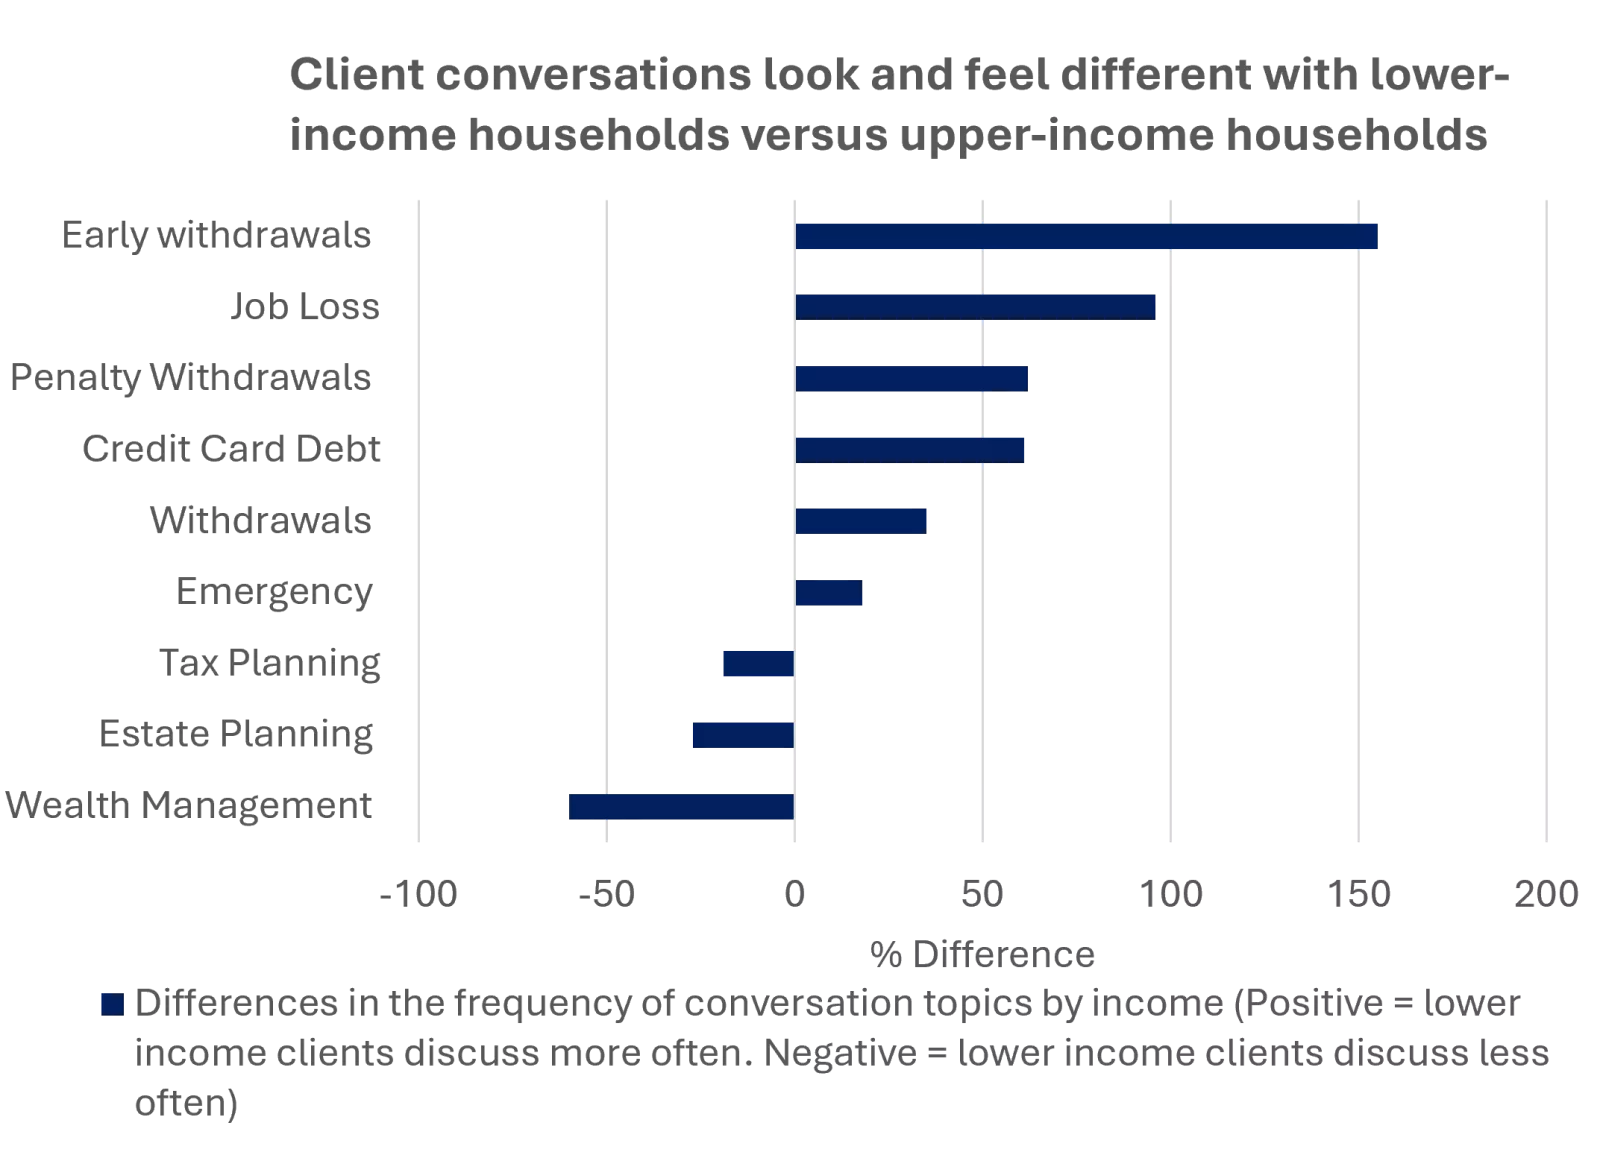
These data reveal a stark divide between households earning less than $50,000 annually and those earning $200,000 or more. For every 10 higher earners discussing job loss over the past year, 17 lower-income households had the same conversation. We see a similar gap in discussions around credit card debt, and lower-income households voiced concerns over affordability three times as often.
Most striking is that impact that these challenges can have on savings. For every 10 high-income households discussing early withdrawals from retirement accounts, 26 lower-income households are having that conversation. Worse, these are often penalty-triggering distributions. For every 10 wealthy households discussing these penalties, 15 lower-income households are talking about the same costly trade-off, sacrificing their financial future for today's necessities.
The story looks different among higher-income households, who are less likely to report emergencies or other signs of distress. Instead, the conversation flips: for every 10 lower-income households discussing wealth management, 26 wealthier households do the same. The disparity is even starker for tax planning – for every 10 lower-income households discussing tax strategy, 35 high-income households are having that conversation, reflecting fundamentally different financial realities.
Let’s dig into the forces driving these contrasting trends.
A pay chasm
Part of this shift in spending power reflects long-lasting gaps in pay.
Wage growth for the highest earning 5% of Americans has increased twice as fast as that for the bottom 20% since 1980, according to the U.S. Census Bureau. As a result, the top 5% now takes home nearly a quarter of total income, up from 17% in 1980, while the top 20% enjoys more than half.
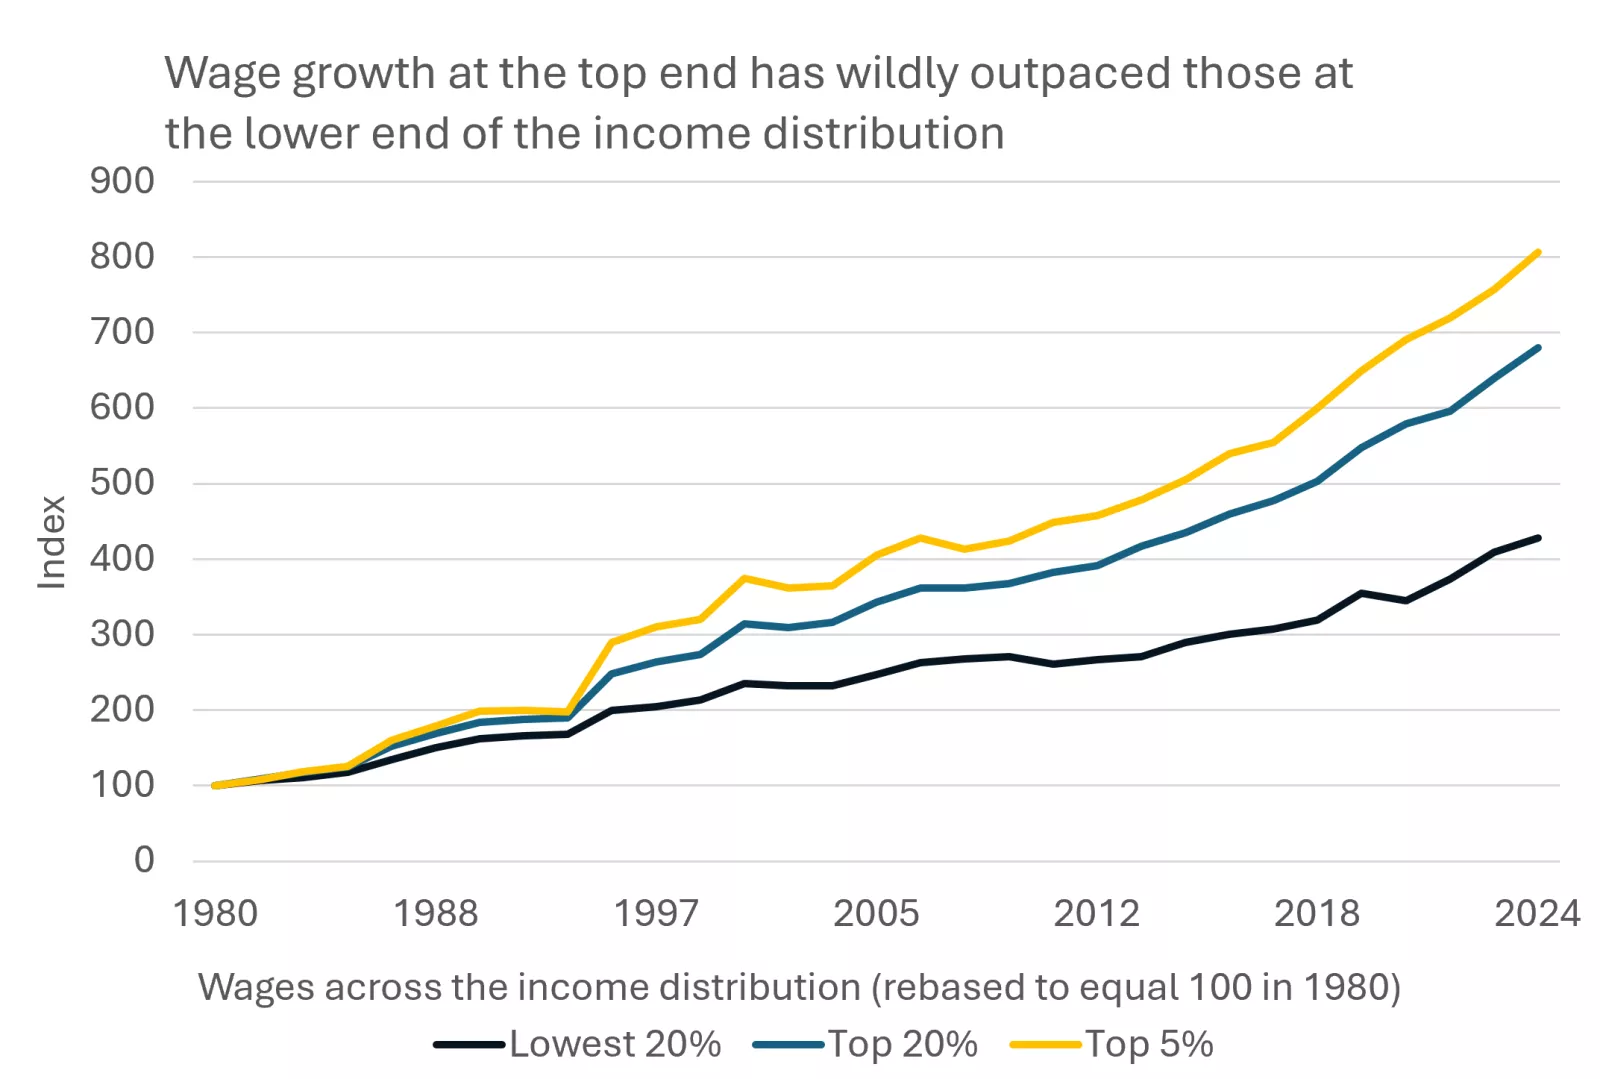
Source: U.S. Census Bureau, Current Population Survey, 1968 to 2025 Annual Social and Economic Supplements (CPS ASEC)
There was a period after the pandemic when this trend moved into reverse as wages for lower income workers surged. However, these gains have since moderated, moving measures of wage inequality higher again. The recent outburst of inflation has exacerbated these gaps. Rising prices for essentials like groceries, gas, and rents, which account for a larger share of lower income household budgets, have hurt their spending power. Between 2020 and 2025 the inflation rate for the bottom 20% of earners has been 2 percentage points higher than the top quintile – the equivalent of a full year of inflation based on the Fed's 2% target, according to the Federal Reserve Bank of New York.
This year's spike in oil prices will have worsened the pressure on lower income households, with gas accounting for 3.7% of low-income households' total spending, a percentage point above that for the highest earners, according to the U.S. Bureau of Labor Statistics Consumer Expenditure Survey (CES).
Money makes money
The surge in asset prices after the pandemic has added to the K-shape narrative.
Wealthier households hold larger and more diversified portfolios of assets, putting them in a strong position to benefit from rising prices. On the eve of the pandemic the top 20% held around $25tn in corporate equities and mutual funds, according to the Federal Reserve Board. Fast forward to today, these holdings have exploded in value to nearly $45tn.
Lower income households are far less likely to hold equities, or hold these in smaller quantities, limiting their ability to participate in this upside. Many own their homes and have therefore benefitted from rising house prices. However, these paper gains are relatively illiquid, and more recently we have seen house prices stall, while equity markets continue to deliver. All told, the bottom 40% of the income distribution holds just 8% of household wealth.
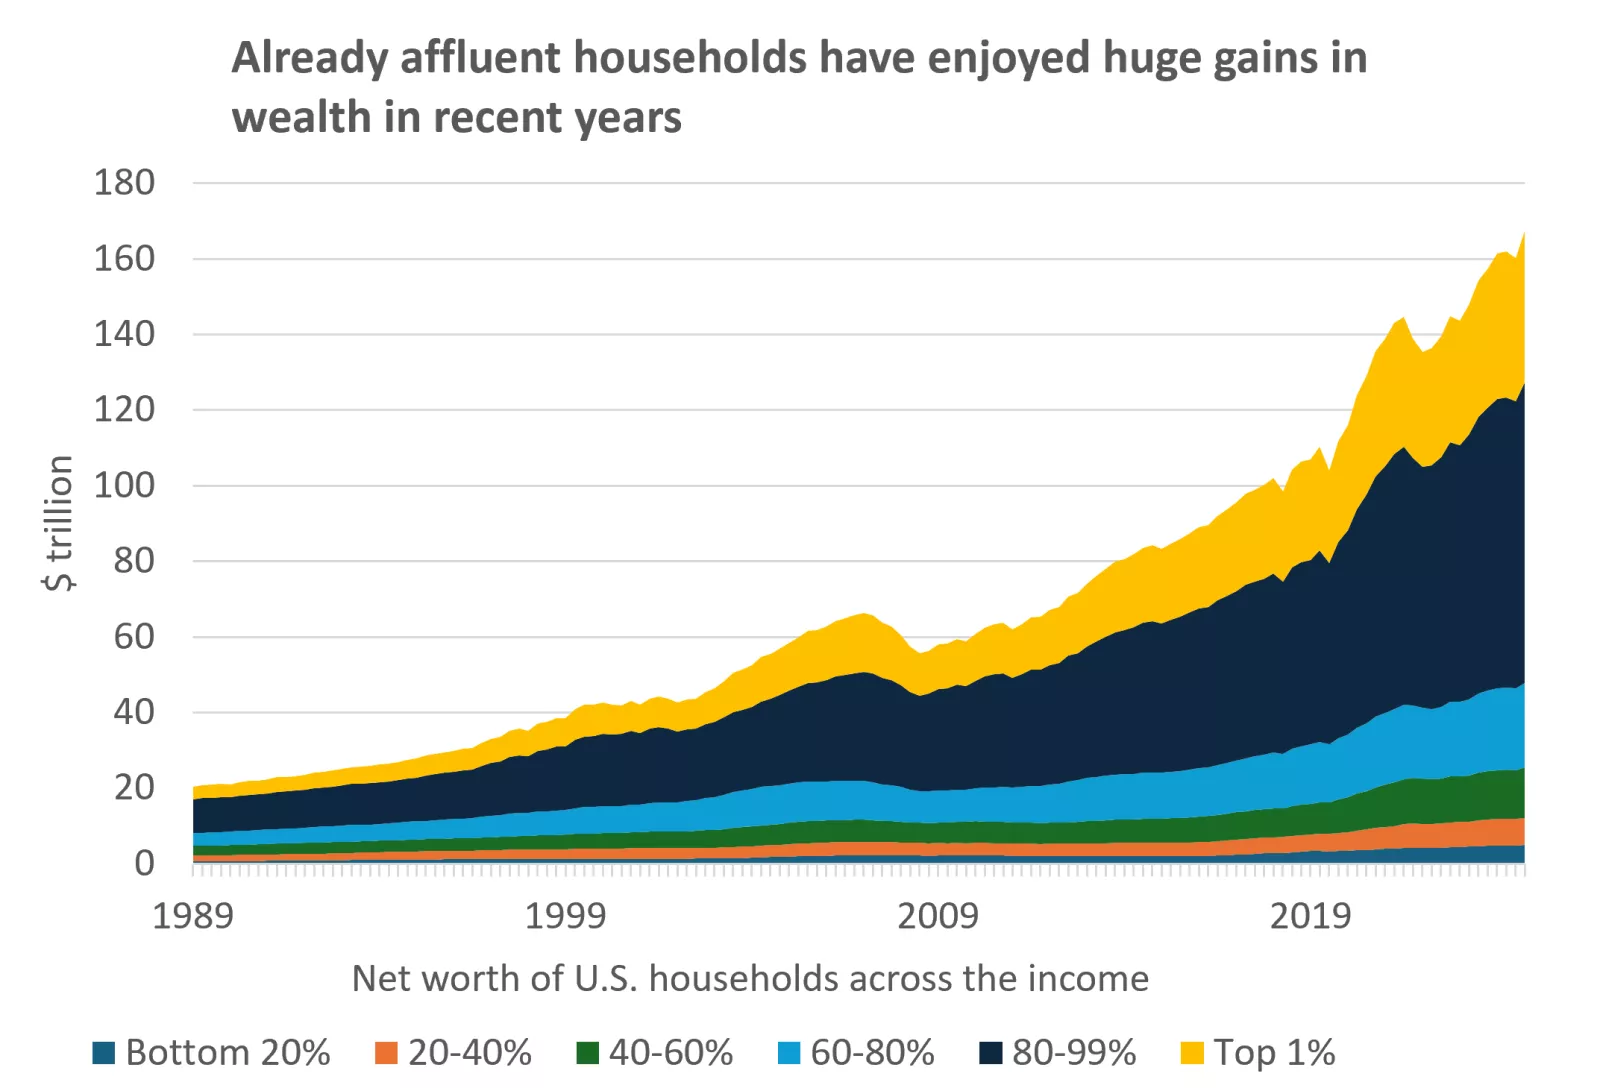
Source: Federal Reserve Board
Edward Jones Pulse of North America trend:
The same disparities in wealth are also apparent across our client population. The median account size of higher income households, earning $200,000 or more, is nearly ten times larger than lower income clients. Moreover, around half of our lower income client assets sit in retirement accounts, a notably greater share than higher earning clients who hold a more diverse range of investment accounts.
Despite this lower starting point, we think that working with a financial adviser can help our clients earning up to $50,000 build stronger financial security. Around half of this cohort use our advisory funds and guided investment programs, which include services such as portfolio monitoring, rebalancing and investment guidance tailored to a client's objectives and risk tolerance.
Paycheck to paycheck
Finally, while in aggregate household personal finances look healthy, scratching beneath the surfaces there appear to be weak spots.
One in eight Americans in the bottom 20% of the income distribution have maxed out their credit card balances, well below the one in 20 across the top 20%, according to the Federal Reserve Bank of New York. These borrowers are at higher risk of falling into delinquency, and indeed we have seen delinquencies rise to levels not seen since the aftermath of the financial crisis.
This rhymes with the experience of our lower-income clients who are frequently discussing issues with credit card debt and more often feel financial anxiety. Data from the Federal Reserve find that 37% of total U.S. households would be unable to cover an unexpected $400 expenses with cash and 45% do not have emergency savings that could last three months.
What is clear is that Americans at the lower end of the income distribution have limited financial buffers, better explaining their anxiety over the outlook and reluctance to spend.
Why does this matter?
The Fed has concerns over the sustainability of the K-shaped expansion. Certainly, a reliance on a small portion of consumers to drive overall consumer spending could leave the economy vulnerable should sentiment among this group shift. The central bank will hope that a reacceleration in hiring this year, and an eventual slowdown in inflation, will support personal finances and broaden growth.
The K-shaped economy has important investment implications too. Companies that cater to higher income consumers might be better placed against the backdrop of this bifurcation. On the flip side, firms offering everyday essentials to lower income households might struggle, and our current sector guidance suggests holding underweight allocations to "consumer staples" companies considering these headwinds.
What does this mean for you?
Economists tend to distill the economy into simple stats – how fast is GDP growth running? What is the unemployment rate? How high is inflation? The K-shaped economy is a useful reminder of how differently families and businesses across then U.S. experience these headlines. Our financial advisers can help provide bespoke and tailored support for you and your specific circumstances.
For households fortunate enough to be on the upward arm of the K, the last few years might have moved you closer to your financial goals. This progress might call for more with sophisticated financial planning and investment management, a wider range of investment solutions and tax and estate considerations. Moreover, our research on financial fulfillment suggests that most high earners are not yet feeling financially fulfilled, despite their recent success. Our advisers can help define what this destination looks like and help these clients get there.
For households on the other side of the K, or perhaps those feeling like they are in the middle of these two extremes, progress might feel frustratingly slow. A financial adviser can build a financial plan that in the first instance builds greater near-term resilience, before helping to establish long-term financial goals and supporting an investment strategy to help achieve these. A disciplined, diversified investment approach can help investors pursue their long-term financial goals, although investment results will vary and are not guaranteed.
James McCann
Senior Economist
Investment Strategy
All data cited sourced from U.S. Bureau of Labor Statistics, Bureau of Economic Analysis, Federal Reserve Board, Federal Reserve Bank of New York, U.S. Census Bureau
You don’t have to go on your investment journey alone.
Wherever you are, there’s an Edward Jones financial advisor right down the street. You can schedule a free initial meeting to talk about your goals and learn about ways we can help you.
Important information:
Investment strategies involve risk, including the possible loss of principal. Outcomes depend on individual circumstances and market conditions. Diversification does not guarantee a profit or protect against loss in declining markets. Edward Jones, its employees and financial advisors cannot provide tax or legal advice. Edward Jones is a dually registered broker-dealer and investment adviser. Edward Jones Advisory Solutions® is a discretionary wrap fee program that provides investment advisory services. This material is not individual investment advice and investors should consider their own objectives and risk tolerance before making investment decisions.