Weekly market wrap
Published May 3, 2024


Key points:
- Inflation readings so far in 2024 have revealed that the back of inflation has yet to be broken. Last week, the Federal Reserve held interest rates steady but indicated conditions are not improving at a pace that would support a change in policy setting anytime soon. We still believe the next Fed rate move will be a cut. But we suspect it will be much later in the year than we anticipated before a cut can confidently be considered.
- The labor market played both the villain and the hero for the markets last week. Early week labor cost data stoked concerns of ongoing inflation, while the end-of-week jobs report came in cooler than anticipated, soothing concerns while still exhibiting signs that employment conditions remain supportive for consumers.
- With the lion’s share of S&P 500 companies having reported first-quarter results, the profit picture continues to brighten. While the Fed and jobs report grabbed most of the attention last week, incoming quarterly announcements have largely been beating expectations, while management commentary and outlooks have been rather upbeat, supporting recent upward revisions to estimates for 2024 profit growth.
After five months of sharp and steady gains beginning last November, the mood in the financial markets has shifted in recent weeks. The catalysts for the swing — Fed policy, the jobs market and corporate earnings — were all in the spotlight last week. And while the net result was a gain for stocks (starting May off on an up note following April’s decline, which was the first monthly loss since this past October), recent market swings reflect a new set of facts emerging from incoming data.
So what changed? And does this change our opinion on the outlook for the markets? Here’s our take:
Fed policy: From “when” to “if”
Recent sticky inflation pushes back the Fed’s rate cut timeline
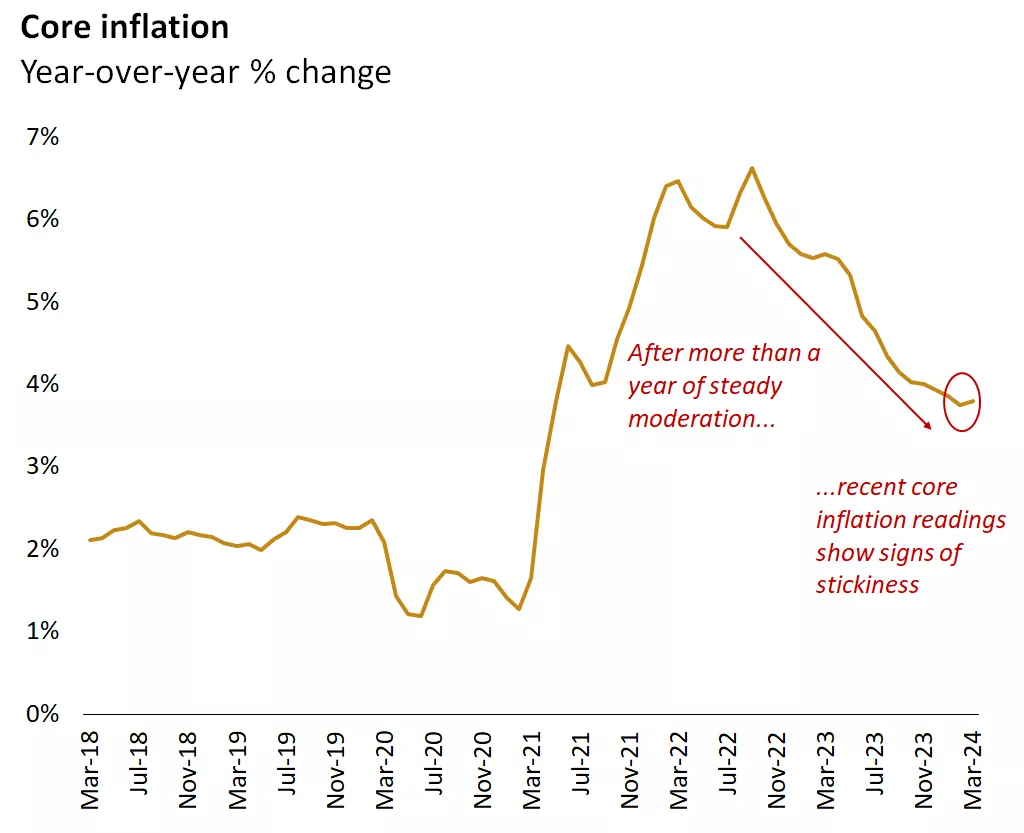
This chart shows the year-over-year change in U.S core CPI.
This chart shows the year-over-year change in U.S core CPI.
Shelter prices must moderate more to help lower inflation.
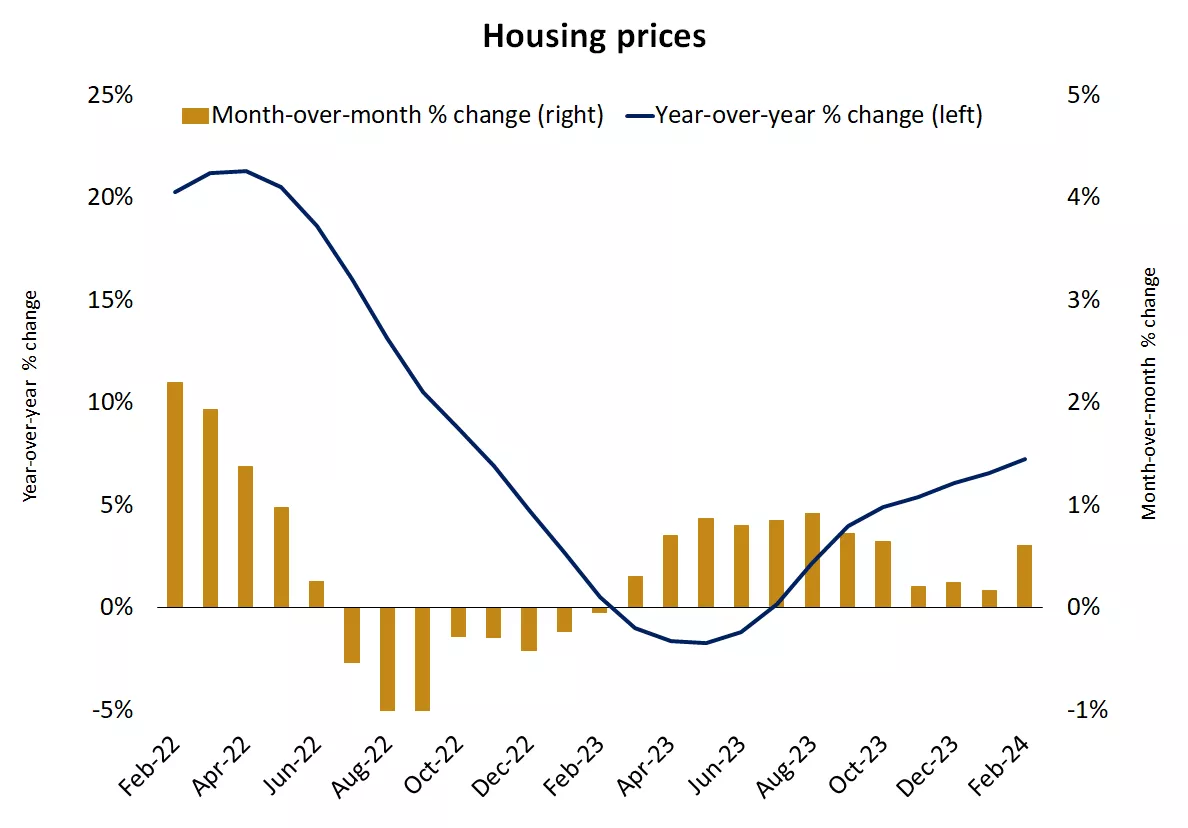
This chart shows the month-over-month and year-over-year percentage change in the S&P/Case-Shiller Home Price Index.
This chart shows the month-over-month and year-over-year percentage change in the S&P/Case-Shiller Home Price Index.
Labor market: Looking for Goldilocks
Monthly job gains slowed in April but remain consistent with a healthy labor market
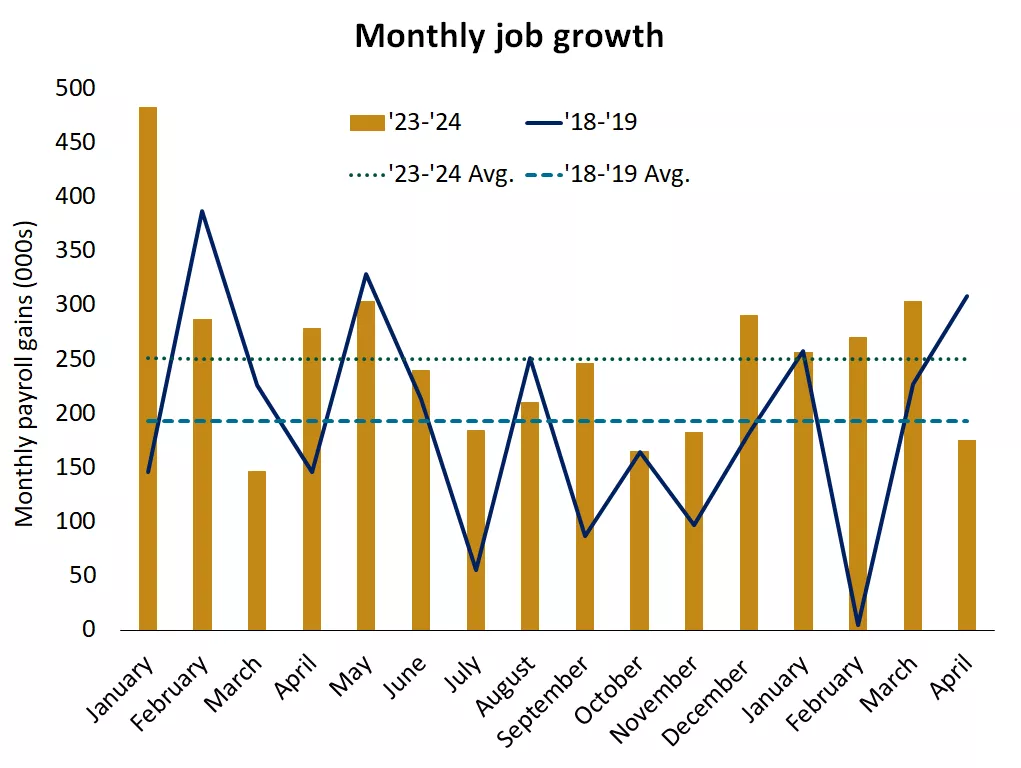
This chart shows the month-to-month and average trend in U.S. nonfarm payrolls from January 2023 - April 2024 & from January 2018 - April 2019.
This chart shows the month-to-month and average trend in U.S. nonfarm payrolls from January 2023 - April 2024 & from January 2018 - April 2019.
Slower wage growth is helping ease inflation concerns.
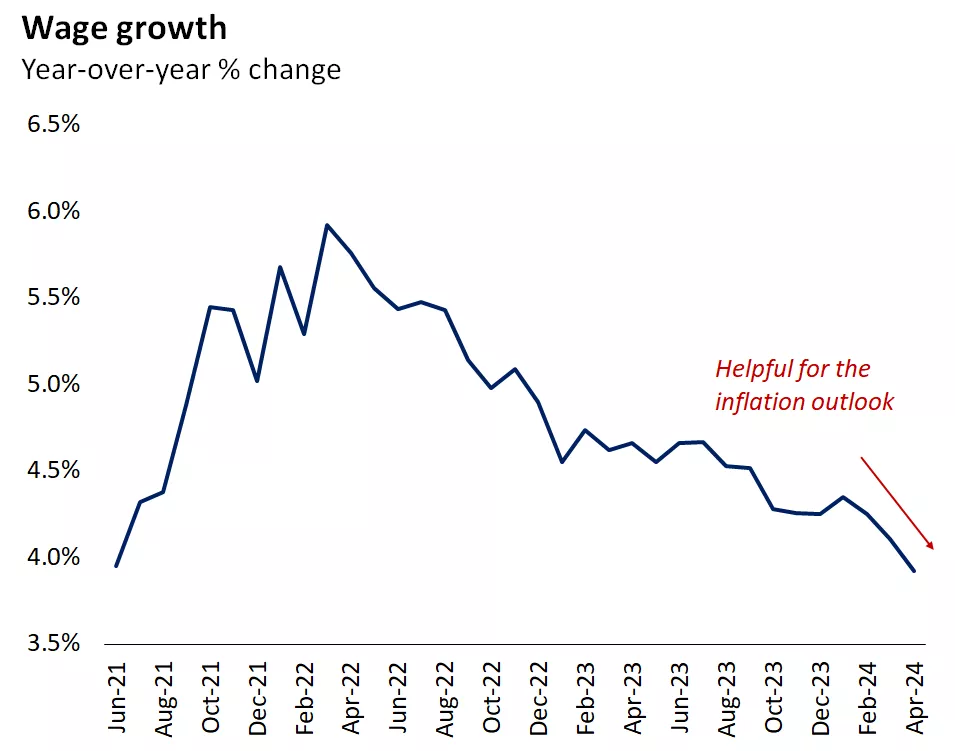
This chart shows the year-over-year change in U.S. average hourly earnings.
This chart shows the year-over-year change in U.S. average hourly earnings.
Earnings: Quietly adding support
Stocks slipped as Fed rate cut expectations were dashed.
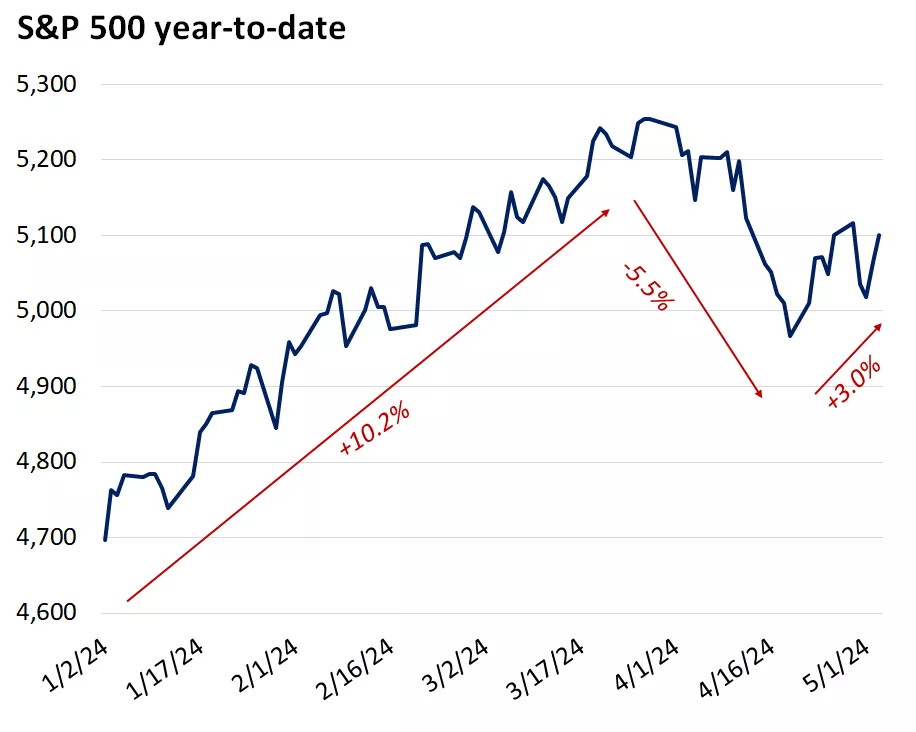
This chart shows the year-to-date performance of the S&P 500 Index. Past performance does not guarantee future results.
This chart shows the year-to-date performance of the S&P 500 Index. Past performance does not guarantee future results.
Earnings growth should set the tone for market performance this year.
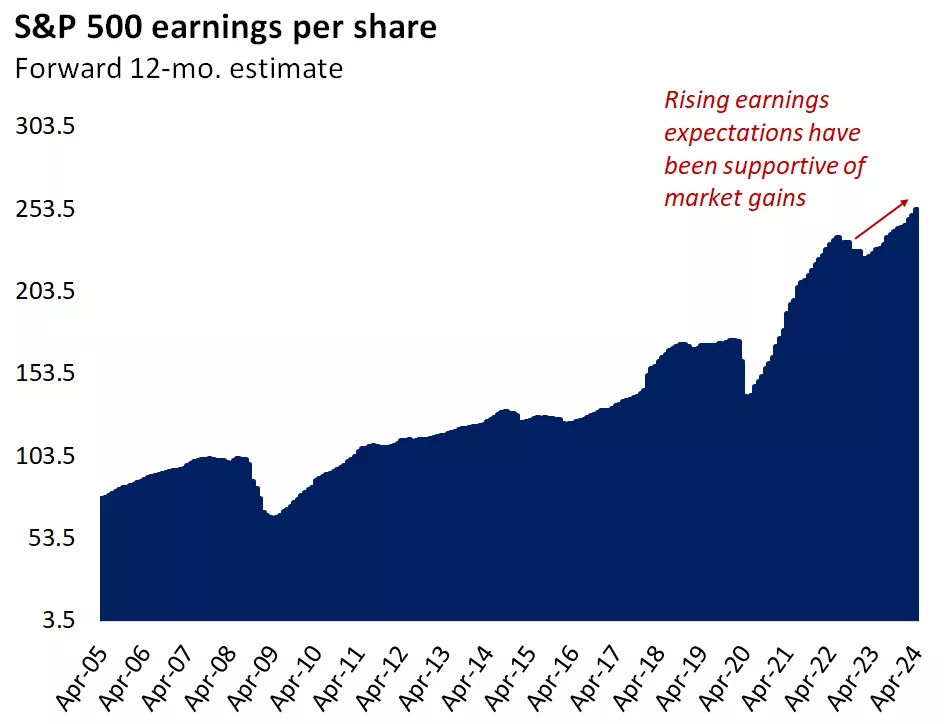
This chart shows the twelve-month consensus estimates for S&P 500 EPS. Past performance does not guarantee future results.
This chart shows the twelve-month consensus estimates for S&P 500 EPS. Past performance does not guarantee future results.
Valuations have risen but don’t look overextended to us if earnings growth remains strong.
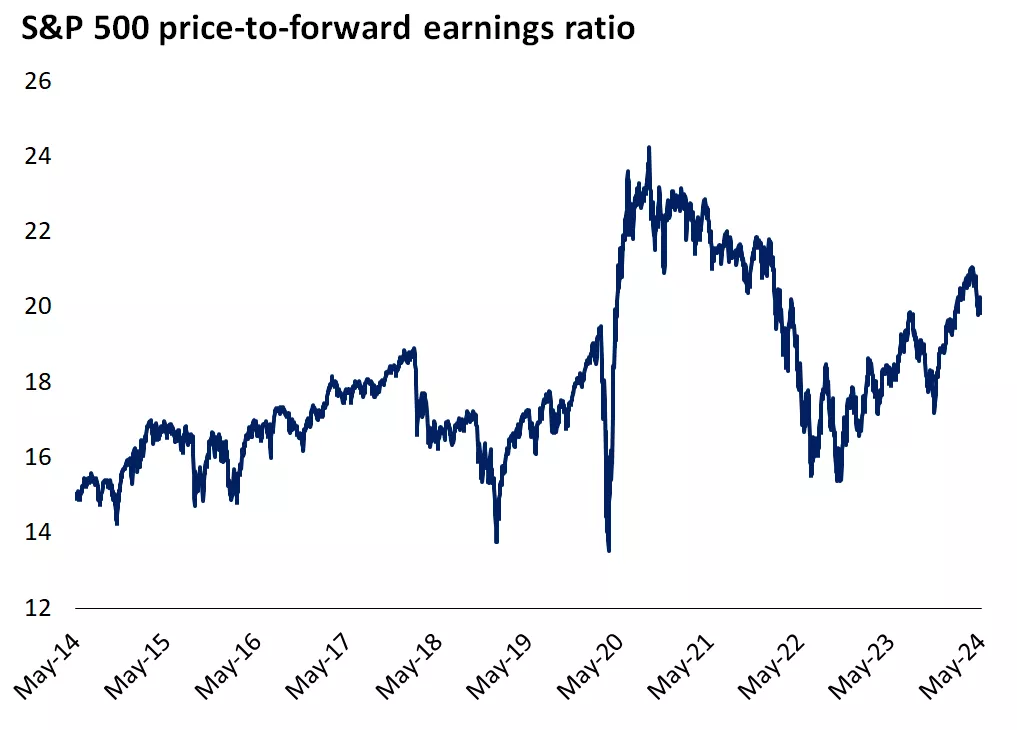
This chart shows the trend in the next-twelve-months price-to-earnings ratio of the S&P 500. Past performance does not guarantee future results.
This chart shows the trend in the next-twelve-months price-to-earnings ratio of the S&P 500. Past performance does not guarantee future results.
Market leadership has broadened beyond tech to cyclicals and defensives.
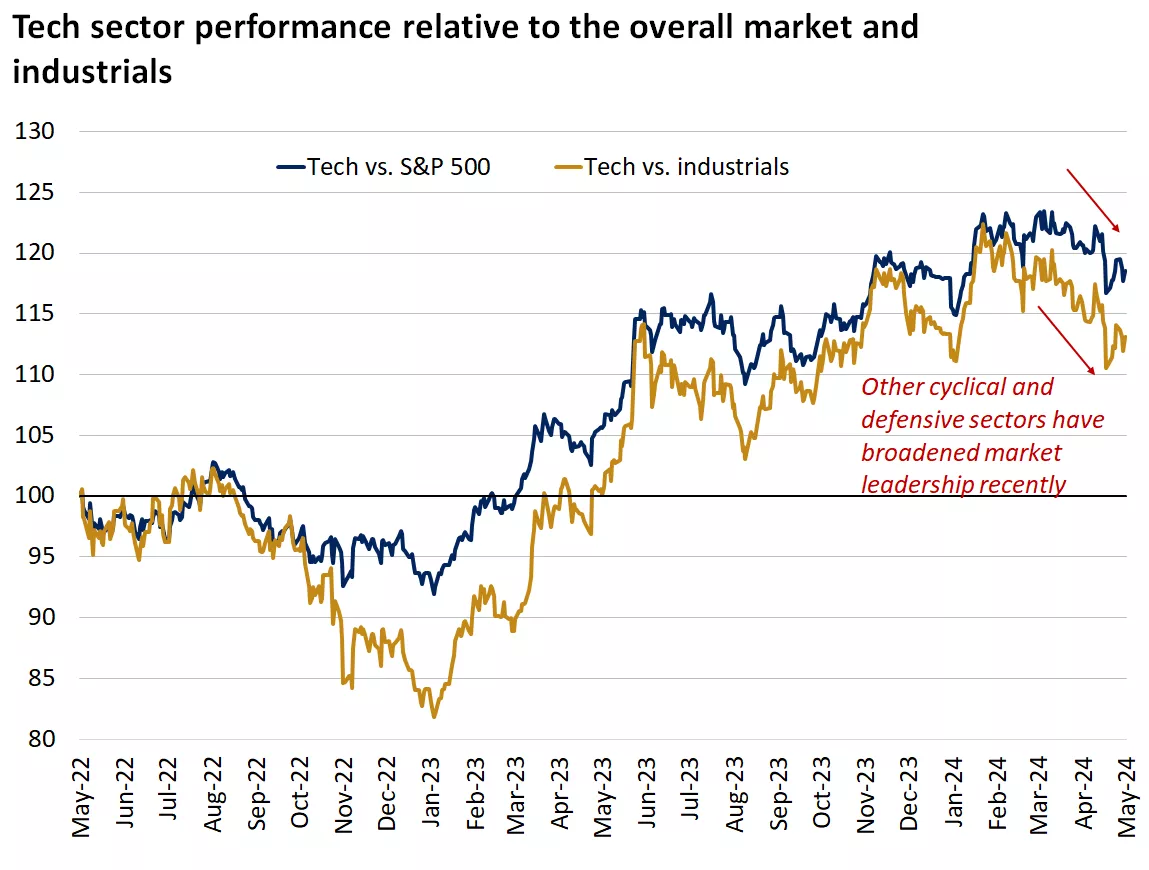
This chart shows the relative performance of the S&P 500 technology sector relative to the S&P 500 Index and to the industrials sector of the S&P 500. Leadership has broadened recently with sectors outside of technology performing well. Past performance does not guarantee future results.
This chart shows the relative performance of the S&P 500 technology sector relative to the S&P 500 Index and to the industrials sector of the S&P 500. Leadership has broadened recently with sectors outside of technology performing well. Past performance does not guarantee future results.
Craig Fehr, CFA
Investment Strategist
Sources: *FactSet, total return of the S&P 500 index. **The Magnificent Seven are Alphabet, Amazon, Apple, Meta Platforms, Microsoft, NVIDIA and Tesla.
| INDEX | CLOSE | WEEK | YTD |
|---|---|---|---|
| Dow Jones Industrial Average | 38,676 | 1.1% | 2.6% |
| S&P 500 Index | 5,128 | 0.5% | 7.5% |
| NASDAQ | 16,156 | 1.4% | 7.6% |
| MSCI EAFE* | 2,309.49 | 1.5% | 3.3% |
| 10-yr Treasury Yield | 4.50% | -0.2% | 0.6% |
| Oil ($/bbl) | $78.13 | -6.8% | 9.0% |
| Bonds | $96.19 | 0.9% | -2.4% |
Source: FactSet, 5/3/2024. Bonds represented by the iShares Core U.S. Aggregate Bond ETF. Past performance does not guarantee future results. *Morningstar Direct 5/6/2024.
Important economic releases this week includes the Michigan Consumer Sentiment Survey and outstanding consumer credit data.
Review last week's weekly market update.
Craig Fehr is a principal and the leader of investment strategy for Edward Jones. Craig is responsible for analyzing and interpreting economic trends and market conditions, along with constructing investment strategies and asset allocation guidance designed to help investors reach their financial goals.
He has been featured in Barron’s, The Wall Street Journal, the Financial Times, SmartMoney magazine, MarketWatch, the Financial Post, Yahoo! Finance, Bloomberg News, Reuters, CNBC and Investment Executive TV.
Craig holds a master's degree in finance from Harvard University, an MBA with an emphasis in economics from Saint Louis University and a graduate certificate in economics from Harvard.
The Weekly Market Update is published every Friday, after market close.
This is for informational purposes only and should not be interpreted as specific investment advice. Investors should make investment decisions based on their unique investment objectives and financial situation. While the information is believed to be accurate, it is not guaranteed and is subject to change without notice.
Investors should understand the risks involved in owning investments, including interest rate risk, credit risk and market risk. The value of investments fluctuates and investors can lose some or all of their principal.
Past performance does not guarantee future results.
Market indexes are unmanaged and cannot be invested into directly and are not meant to depict an actual investment.
Diversification does not guarantee a profit or protect against loss in declining markets.
Systematic investing does not guarantee a profit or protect against loss. Investors should consider their willingness to keep investing when share prices are declining.
Dividends may be increased, decreased or eliminated at any time without notice.
Special risks are inherent in international investing, including those related to currency fluctuations and foreign political and economic events.
Before investing in bonds, you should understand the risks involved, including credit risk and market risk. Bond investments are also subject to interest rate risk such that when interest rates rise, the prices of bonds can decrease, and the investor can lose principal value if the investment is sold prior to maturity.