Weekly market wrap
Published April 12, 2024


Key Takeaways:
- A hotter-than-expected inflation report, alongside rising concerns of an Iranian retaliatory strike on Israel, sparked a bout of market indigestion last week. Stocks moved lower, while interest rates and gold prices moved higher.
- We think inflation will continue to trend lower, but recent data reveal the pace of improvement has stalled. We don’t believe this eliminates the prospects of rate cuts later this year, but it does complicate the picture for the Federal Reserve in the coming months. It’s likely the Fed will have to cut rates less than previously anticipated as it waits for further confirmation that inflation is under control.
- Stocks have pulled back in recent days but remain only slightly below all-time highs. We think some temporary weakness is reasonable given the strength of the recent rally and the adjustments to policy expectations. That said, markets have handled this news fairly well, which we think reflects the still-favorable outlook for economic and corporate earnings growth.
Last week’s solar eclipse captured a ton of eyeballs (literally), which is logical considering the rarity of the event. But there was another seemingly rare event last week: The stock market turned lower.
For those of you who prefer your markets to move in a straight line higher, you may not want to stare directly at the chart below. If you do, and if you squint hard enough, you’ll notice what appears to be a kink and a downward slope at the right end of the line, as hotter-than-expected inflation data eclipse the enthusiasm around upcoming Fed rate cuts.
This raises the questions: What’s up with consumer prices? And does this latest inflation data set a new, dimmer course for stock prices ahead? We’ve held the view that this rally will eventually need to blink, but broadly, we think there’s still a good case for investors to look up.
Stocks stumble after a steady march higher
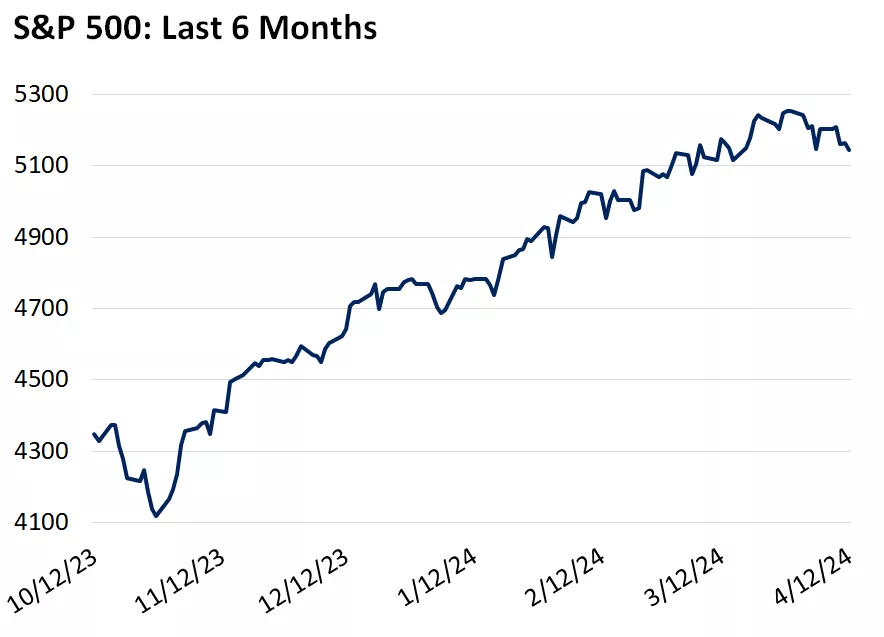
This chart shows the level of the S&P 500 Index over the past six months. Past performance does not guarantee future results.
This chart shows the level of the S&P 500 Index over the past six months. Past performance does not guarantee future results.
The headliner last week was the latest Consumer Price Index (CPI) report, providing a fresh look at the all-important trend in inflation. The results were not what markets were looking for, with CPI coming in hotter than expected.
A look at underlying drivers paints a less concerning picture, but the takeaway is that inflation is not moderating fast enough for the Fed to cut rates immediately. But we’d emphasize that inflation’s slower-than-desired descent is primarily a function of a strong economy and healthy demand.
Consumer prices rose by 3.5% year over year in March, up from 3.2% the prior month. Core CPI, which strips out volatile food and energy prices, held steady at 3.8%, coming in slightly above consensus expectations.
Services prices remain the fly in the ointment, with particularly large increases in medical costs and insurance premiums playing a role last month. While not captured in core inflation, the recent rise in oil prices is also driving worries of renewed upward pressure on headline CPI.
The pace of improvement in core CPI has slowed
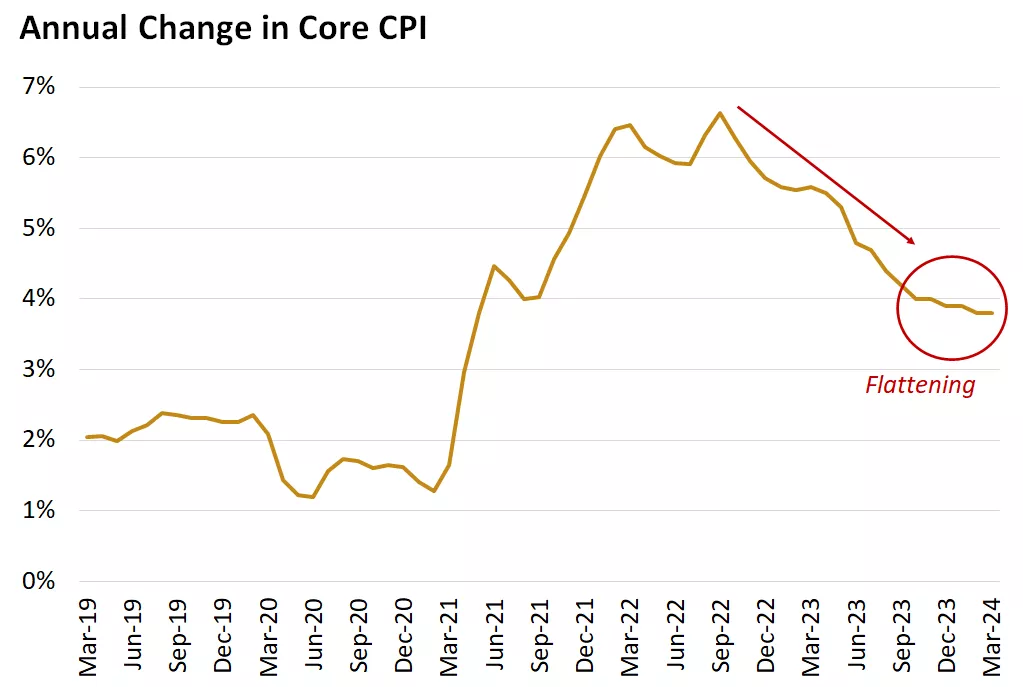
This chart shows the year-over-year percent change in U.S. core CPI. U.S. core CPI readings have leveled off in recent months after declining for much of 2023.
This chart shows the year-over-year percent change in U.S. core CPI. U.S. core CPI readings have leveled off in recent months after declining for much of 2023.
Moderating goods prices continue to help the overall inflation picture
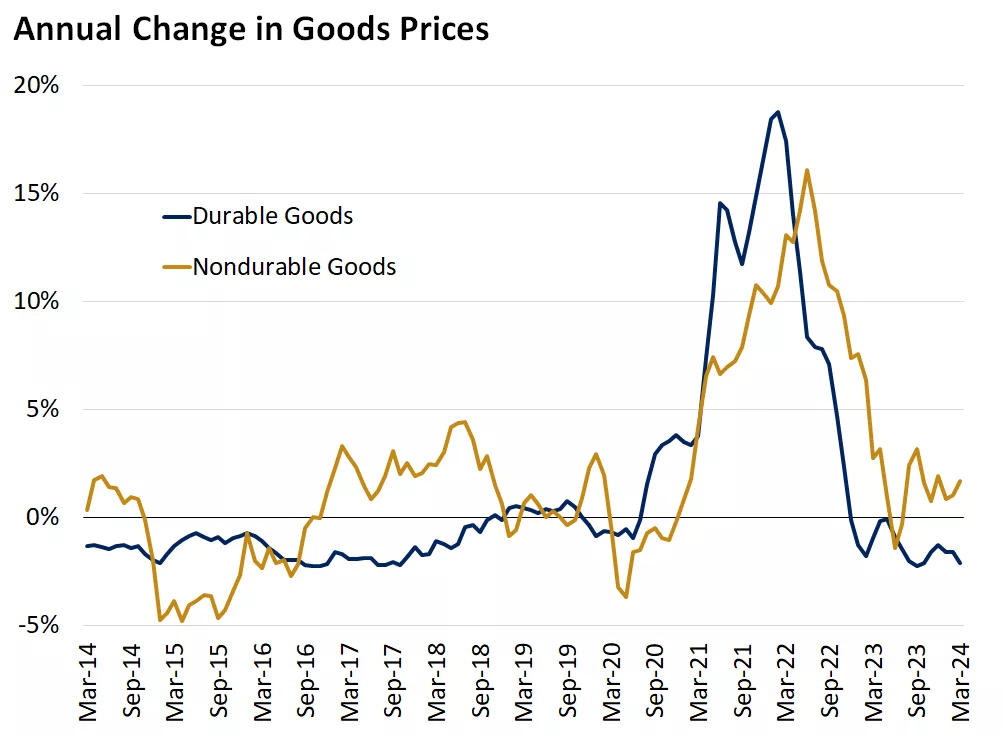
This chart shows the year-over-year percent change in U.S. goods CPI. Goods prices declined sharply in 2022 & 2023 as supply chains normalized but have leveled off in recent months.
This chart shows the year-over-year percent change in U.S. goods CPI. Goods prices declined sharply in 2022 & 2023 as supply chains normalized but have leveled off in recent months.
The overarching takeaway on the inflation outlook is that CPI is losing some of its downward momentum. The pace of moderation has leveled off in recent months, in part because the bulk of the help from falling goods prices has run its course. This means the next phase will require more help from shelter and services.
Timely rent data suggest there is more room for improvement on shelter prices, which would be welcome relief. Services prices, however, may remain somewhat sticky as we expect them to continue to reflect a healthy consumer demand backdrop.
This is not the worst problem to have, as a strong economy provides a favorable foundation for markets. That said, the low-hanging fruit of disinflation appears to have been picked. This means the next leg — in which core CPI trends toward the Fed’s 2% target — may prove more gradual (and challenging) than hoped.
Improving shelter prices will be key for moderating inflation
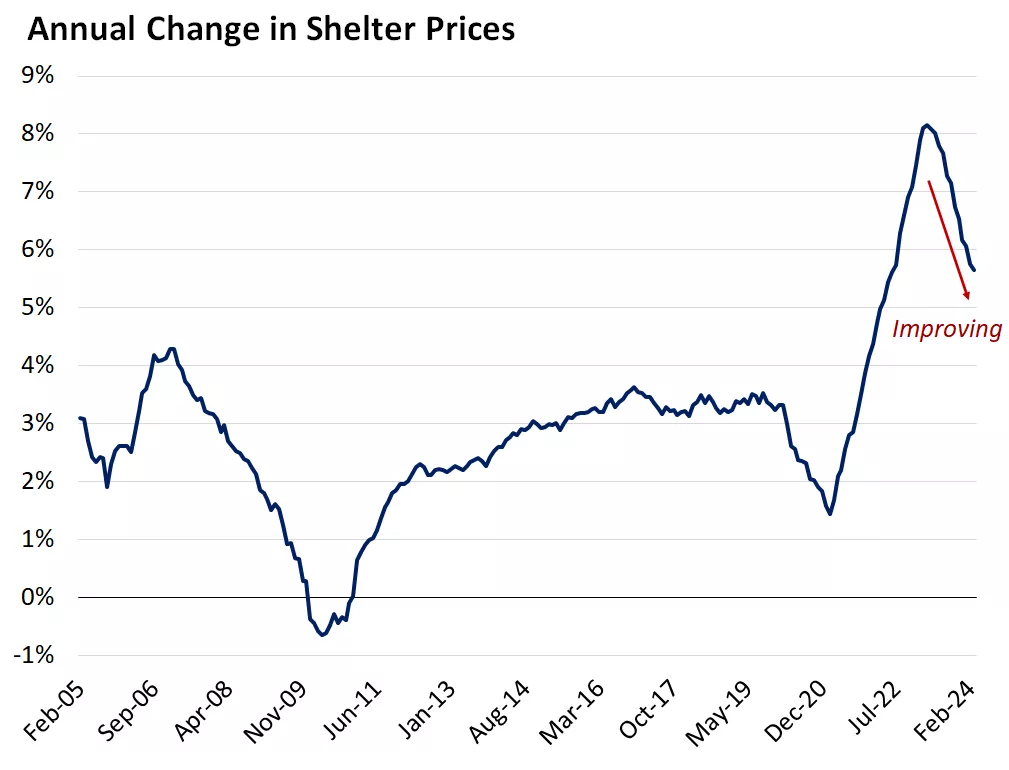
This chart shows the year-over-year change in U.S. city average shelter CPI. Shelter inflation has moderated over the past year but remains elevated.
This chart shows the year-over-year change in U.S. city average shelter CPI. Shelter inflation has moderated over the past year but remains elevated.
This inflation data is being intensely viewed through the lens of what it means for monetary policy settings ahead. We think this complicates the Fed’s plans to cut rates but does not eliminate the broader outlook for loosening policy later this year.
Coming in to 2024, our view was that the markets were far too optimistic about the timing and magnitude of rate cuts this year. Markets were pricing in expectations for six rate cuts in 2024, with the first coming in March. Our expectation was that the first cut would likely be in June, with something closer to three rate cuts in the second half of the year.
Given the string of firmer-than-anticipated CPI reports to start the year, we think the March data all but eliminates the chance of a cut in June. We think the Fed will need several months of evidence that inflation remains in a downtrend before beginning to ease policy. As such, we think the first cut will be pushed back, with fewer cuts this year.
1. In our view, the next move by the Fed will be a cut — we’ll just have to wait a bit longer. The big picture is still one in which monetary policy will get looser this year, a helpful force for the economy and financial markets.
2. While the markets are eager for the first rate cut, it’s far more prudent for the Fed to take its time and ensure inflation is headed sustainably lower. The worst outcome for markets, in our view, would be for the Fed to act prematurely and risk fanning the embers of inflation, then have to return to hiking rates. We’ve seen that movie before (1970s), and it did not go well.
Futures markets quickly lowered rate cut expectations after the CPI report
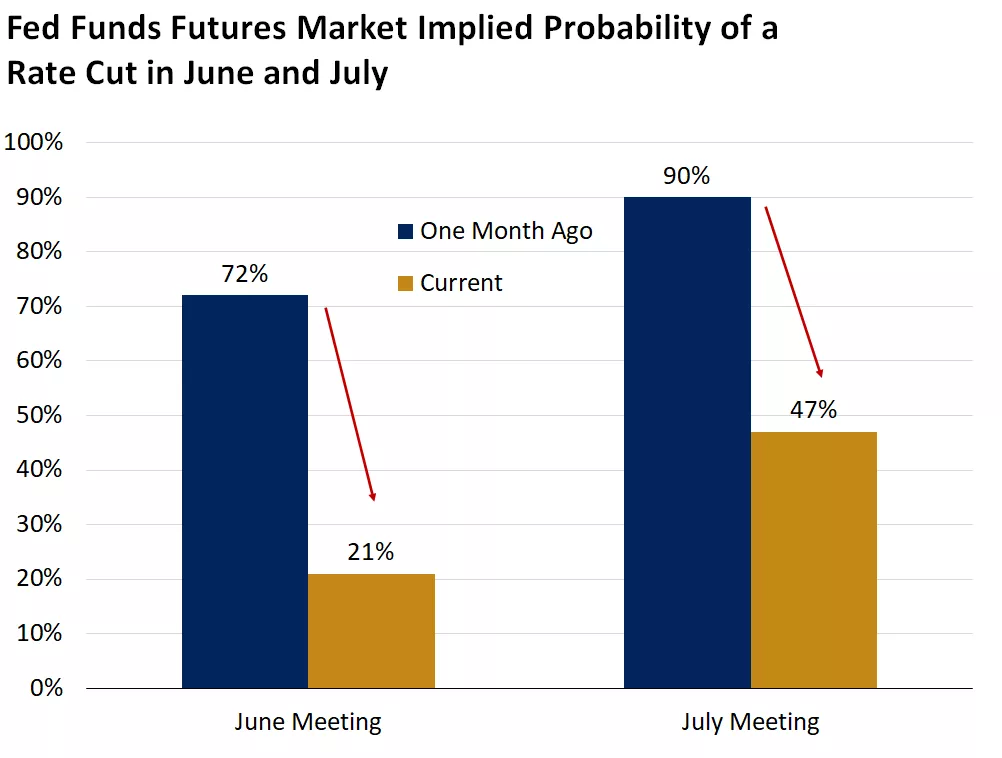
This chart shows the market implied probability of a Fed rate cut at the June and July meetings currently versus one month ago. Markets have lowered expectations over the past month for the Fed to cut rates due to higher inflation readings.
This chart shows the market implied probability of a Fed rate cut at the June and July meetings currently versus one month ago. Markets have lowered expectations over the past month for the Fed to cut rates due to higher inflation readings.
The U.S. stock market has rallied sharply since October 2023, powered in large part by the outlook for Fed rate cuts in 2024, in addition to the AI-fueled enthusiasm behind the tech sector’s surge. The magnitude of the rally might only have been outdone by its steadiness, with the S&P 500 logging nine consecutive weekly gains and a string of new record highs along the way.
Equities appear to have lost some of that oomph so far in April, but the recent weakness is barely noticeable when compared to even routine market pullbacks. We would not be surprised if the markets used this recalibration of Fed rate expectations as an excuse to take a breather, but to us, the underpinnings of the broader uptrend in stocks remain intact.
Market declines — even modest ones — are never pleasant. But we’d point out that, all things considered, equities are behaving fairly well given the sizable adjustment in rate cut expectations.
Over the last two years, we’ve seen the stock market react sharply to the downside when data or commentary indicated the Fed would need to tighten policy further or keep policy tight for longer. We think it is a positive sign that so far in 2024, markets have ratcheted down expectations for rate cuts significantly — from six at the beginning of the year to two as of last week — without a dramatic tantrum.
We think the primary driver of this is an economy that continues to exhibit signs of strength, including some pockets of acceleration (manufacturing, business investment). This supports an outlook for corporate profit growth, even as policy is poised to remain restrictive awhile longer.
Equities have been more resilient to higher rates recently versus previous periods of rising rates
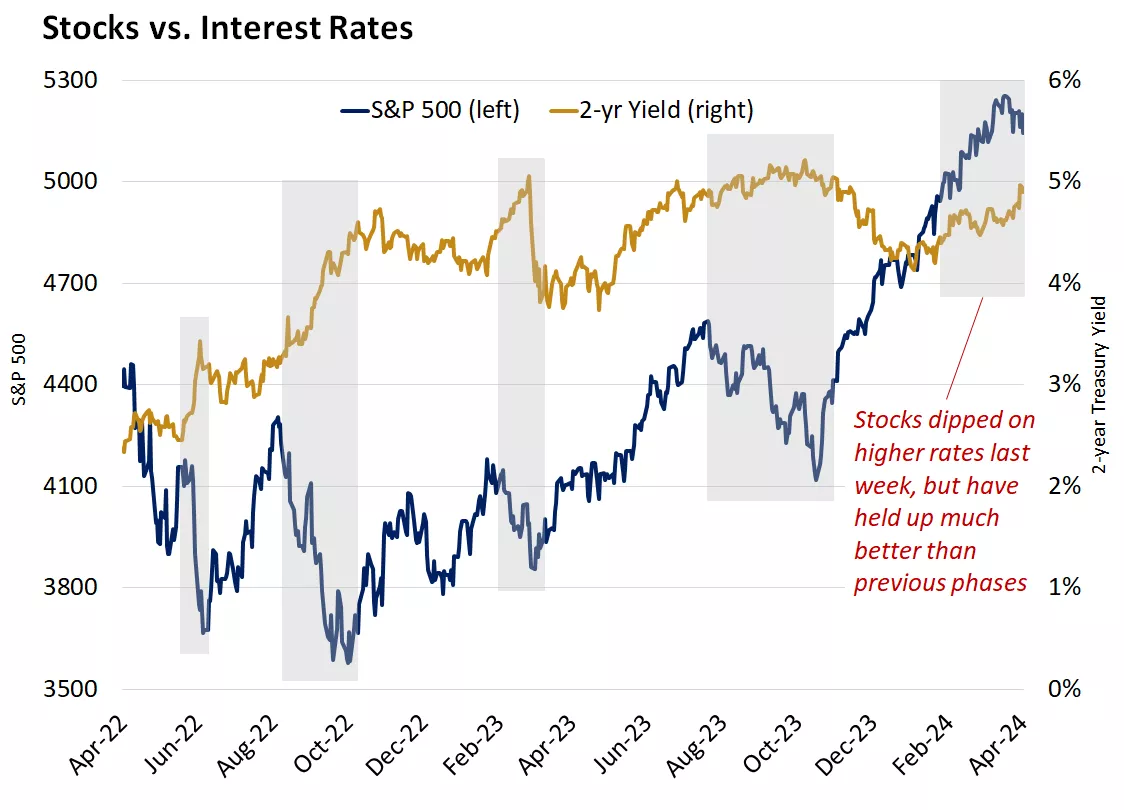
This chart shows the level of the S&P 500 and 2-year U.S. Treasury yield. The S&P 500 pulled back last week in response to a higher-than-expected inflation reading which sent yields higher.
This chart shows the level of the S&P 500 and 2-year U.S. Treasury yield. The S&P 500 pulled back last week in response to a higher-than-expected inflation reading which sent yields higher.
The market adage “sell in May and go away” may have a ring to it, but it’s far more rhyme than reason. The antiquated saying is based on the notion that the stock market is weaker during the summer, but we don’t think, nor does the data confirm, that seasonal portfolio overhauls are sensible. That said, with May fast approaching, nearing the one-third mark for 2024, we think historical perspective is informative.
“Sell in May and go away” more often misses market gains
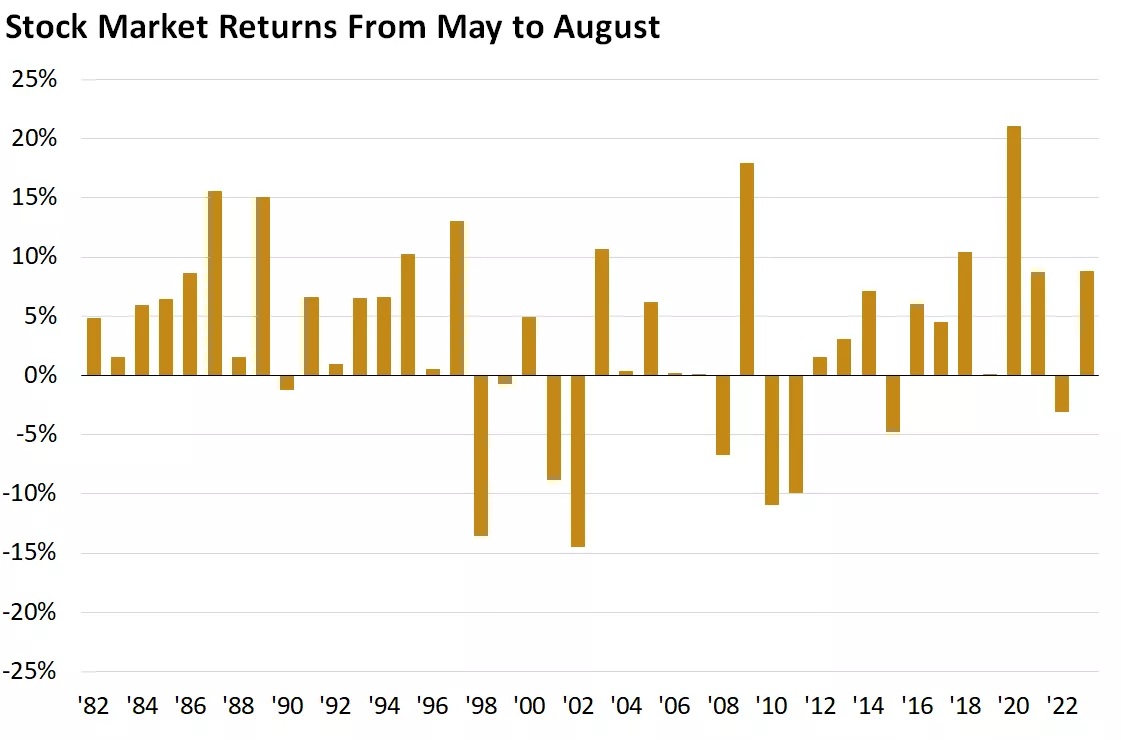
This chart shows the total return of the S&P 500 from May - August from 1982 - 2023. The average gain over this time period has been 3.4%. Past performance does not guarantee future results.
This chart shows the total return of the S&P 500 from May - August from 1982 - 2023. The average gain over this time period has been 3.4%. Past performance does not guarantee future results.
Strong starts have often carried through to solid full-year gains
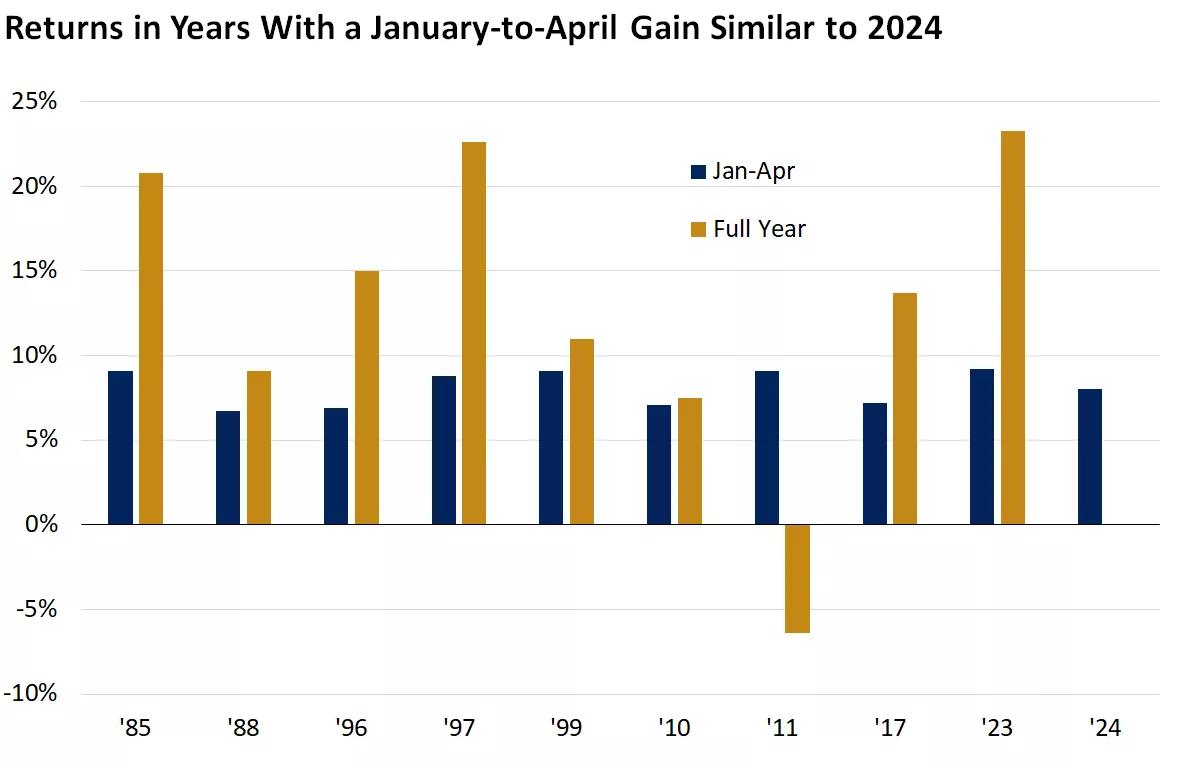
This chart shows how the S&P 500 went on to perform in the full year after rising by 6.5% - 9.5% from January - April. Past performance does not guarantee future results.
This chart shows how the S&P 500 went on to perform in the full year after rising by 6.5% - 9.5% from January - April. Past performance does not guarantee future results.
Craig Fehr, CFA
Investment Strategy
Sources: 1. Bloomberg, total return of the S&P 500 Index.
| INDEX | CLOSE | WEEK | YTD |
|---|---|---|---|
| Dow Jones Industrial Average | 37,983 | -2.4% | 0.8% |
| S&P 500 Index | 5,123 | -1.6% | 7.4% |
| NASDAQ | 16,175 | -0.5% | 7.8% |
| MSCI EAFE* | 2,289.76 | -1.2% | 2.4% |
| 10-yr Treasury Yield | 4.52% | 0.1% | 0.6% |
| Oil ($/bbl) | $85.51 | -1.6% | 19.3% |
| Bonds | $95.96 | -0.7% | -2.6% |
Source: FactSet, 4/12/2024. Bonds represented by the iShares Core U.S. Aggregate Bond ETF. Past performance does not guarantee future results. *Morningstar Direct 4/14/2024.
Important economic releases this week include retail sales data and housing starts.
Review last week's weekly market update.
Craig Fehr is a principal and the leader of investment strategy for Edward Jones. Craig is responsible for analyzing and interpreting economic trends and market conditions, along with constructing investment strategies and asset allocation guidance designed to help investors reach their financial goals.
He has been featured in Barron’s, The Wall Street Journal, the Financial Times, SmartMoney magazine, MarketWatch, the Financial Post, Yahoo! Finance, Bloomberg News, Reuters, CNBC and Investment Executive TV.
Craig holds a master's degree in finance from Harvard University, an MBA with an emphasis in economics from Saint Louis University and a graduate certificate in economics from Harvard.
The Weekly Market Update is published every Friday, after market close.
This is for informational purposes only and should not be interpreted as specific investment advice. Investors should make investment decisions based on their unique investment objectives and financial situation. While the information is believed to be accurate, it is not guaranteed and is subject to change without notice.
Investors should understand the risks involved in owning investments, including interest rate risk, credit risk and market risk. The value of investments fluctuates and investors can lose some or all of their principal.
Past performance does not guarantee future results.
Market indexes are unmanaged and cannot be invested into directly and are not meant to depict an actual investment.
Diversification does not guarantee a profit or protect against loss in declining markets.
Systematic investing does not guarantee a profit or protect against loss. Investors should consider their willingness to keep investing when share prices are declining.
Dividends may be increased, decreased or eliminated at any time without notice.
Special risks are inherent in international investing, including those related to currency fluctuations and foreign political and economic events.
Before investing in bonds, you should understand the risks involved, including credit risk and market risk. Bond investments are also subject to interest rate risk such that when interest rates rise, the prices of bonds can decrease, and the investor can lose principal value if the investment is sold prior to maturity.